"Predictions and explanations are symmetrical and reversible."

- Karl Popper via George Soros

Friday, March 26, 2010

Bubble in China? Edward Harrison's 10 list

Ten ways to spot a bubble in China

Edward Chancellor, author of the seminal book on financial speculation and manias “Devil Take The Hindmost,” is now turning his eyes to China.  He sees a number of red flags which point to excess in China.
Chancellor writes:
In the aftermath of the credit crunch, the outlook for most developed economies appears pretty bleak. Households need to deleverage. Western governments will have to tighten their purse strings. Faced with such grim prospects at home, many investors are turning their attention toward China. It’s easy to see why they are excited. China combines size – 1.3 billion inhabitants – with tremendous growth prospects. Current income per capita is roughly one-tenth of U.S. levels. The People’s Republic also has a great track record. Over the past thirty years, China’s Gross Domestic Product has increased sixteen-fold.
So what’s the catch? The trouble is that China today exhibits many of the characteristics of great speculative manias. The aim of this paper is to describe the common features of some of the great historical bubbles and outline China’s current vulnerability.
Everyone knows there is extreme levels of excess. The latest report from Andy Xie on local governments shows that governments are now depending on asset prices for revenue, much as they did in places like California during America’s housing bubble.
How can we identify a speculative mania? Chancellor says:
bubbles can be identified ex ante, as the economists like to say. There also exists an interesting, if rather neglected, body of research on leading indicators of financial distress. A few years ago, many of these indicators were pointing to rising economic vulnerability in the United States and other parts of the globe. Today, those red flags are flying around Wall Street’s current darling, The People’s Republic of China.
James Rickards thinks this is the greatest bubble in history. Even Sino-enthusiast Stephen Roach is pointing to a bubble in China. He just thinks the government will be able to prevent its dragging down the real economy.
That’s because Beijing was vigilant in preventing asset and credit bubbles from spilling over into the real side of the Chinese economy. This was very different from the Japan endgame of the late 1980s, where the confluence of equity and property bubbles led to a massive overhang of excess capacity.
Roach’s confidence sounds an awful lot like blind faith in the Chinese authorities to me – exactly the opposite of what Roach’s former colleague Andy Xie is saying.
Chancellor includes this blind faith in the 10 signposts of manias and financial crises (very reminiscent of Kindelberger, by the way).
  1. "Great investment debacles generally start out with a compelling growth story."100% yes. Check.
  2. "Blind faith in the competence of the authorities."See Roach’s comments above or read Goldilocks is not sleeping in America anymore; she’s now in China. Check.
  3. "A general increase in investment is another leading indicator of financial distress. Capital is generally misspent during periods of euphoria. Only during the bust does the extent of the misallocation become clear."See my posts China’s present growth story is built on malinvestment and Jim Chanos still bearish on China, talks malinvestment for evidence that China is misallocating resources. Check.
  4. "Great booms are invariably accompanied by a surge in corruption."Remember this post?: “I want to be a corrupt official when I grow up”. That’s exactly what Chancellor is talking about. Check.
  5. "Strong growth in the money supply is another robust leading indicator of financial fragility. Easy money lies behind all great episodes of speculation from the Tulip Mania of the 1630s – which was funded with IOUs – onward."Andy Xie: Chinese monetary policy has to be tightened Check.
  6. "Fixed currency regimes often produce inappropriately low interest rates, which are liable to feed booms and end in busts."Think Latvia or Argentina. (Are the Baltics the new Argentina?) And we know China’s peg is creating problems because that’s a bone of contention right now. Check.
  7. "Crises generally follow a period of rampant credit growth.""Enron-Esque Characteristics" Hiding An Even More Explosive Credit Growth In China. Check.
  8. "Moral hazard is another common feature of great speculative manias. Credit booms are often taken to extremes due to a prevailing belief that the authorities won’t let bad things happen to the financial system. Irresponsibility is condoned."See Stephen Roach’s comments again. Check.
  9. "A rising stock of debt is not the only cause for concern. The economist Hyman Minsky observed that during periods of prosperity, financial structures become precarious."See #7 again. Check.
  10. "Dodgy loans are generally secured against collateral, most commonly real estate."The Andy Xie story shows you this. Check.
It looks like China is ten for ten. Is China in a bubble blow-off top like Japan post-Plaza accord? I say yes. I believe anyone who thinks this will not end badly is in for a rude awakening. Please comment if you have counterfactuals.
Much more below. Do read the full report. It is a lovely piece of research.

Monday, March 22, 2010

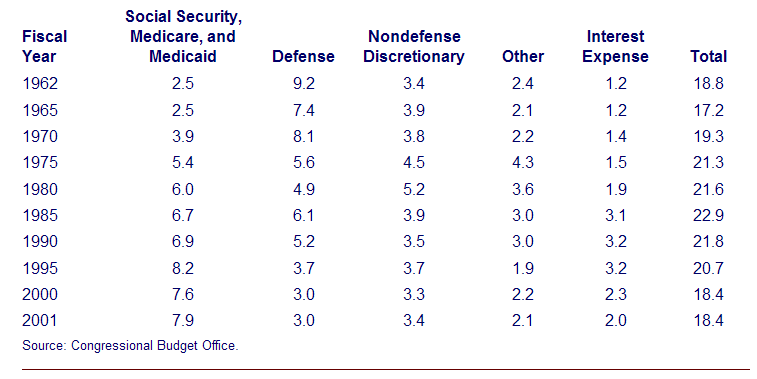
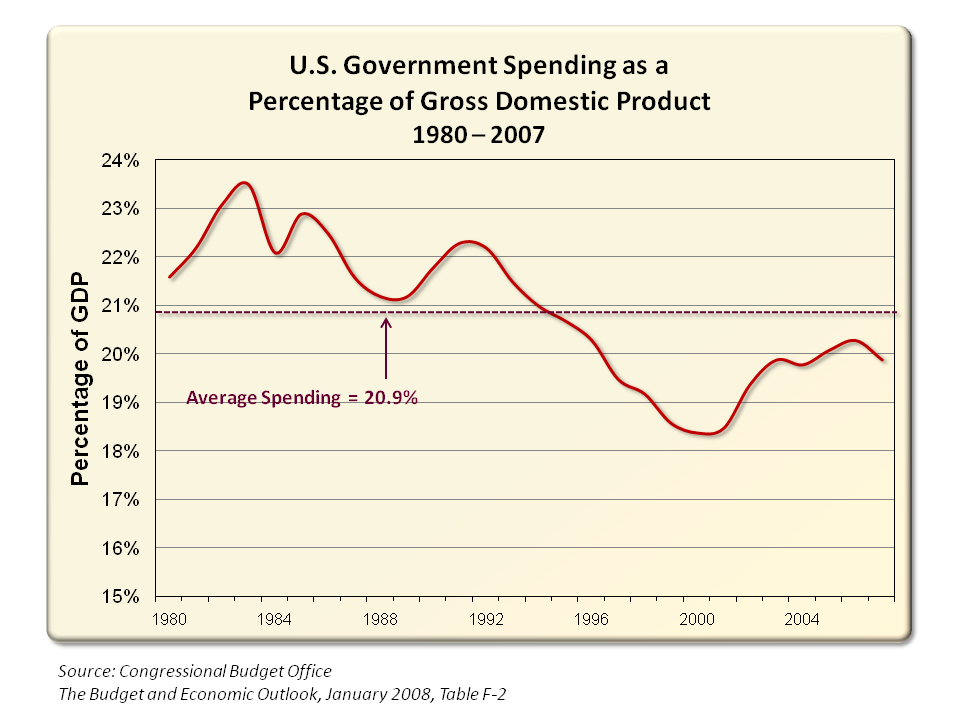
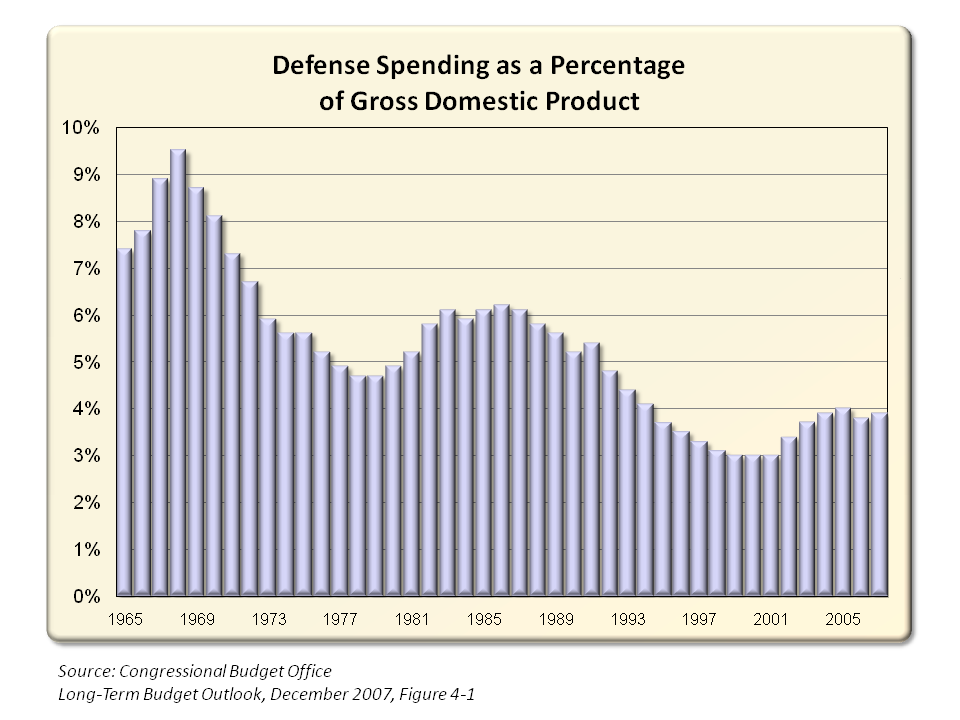
Charts on Federal spending as percent of GDP

Government’s Share of Economy, 1950 to 2075

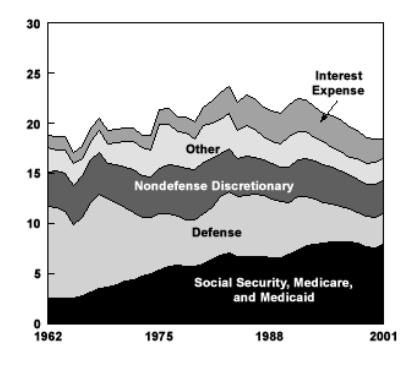
Peter Boockvar dug up these fascinating charts from this CBO report from 2002.
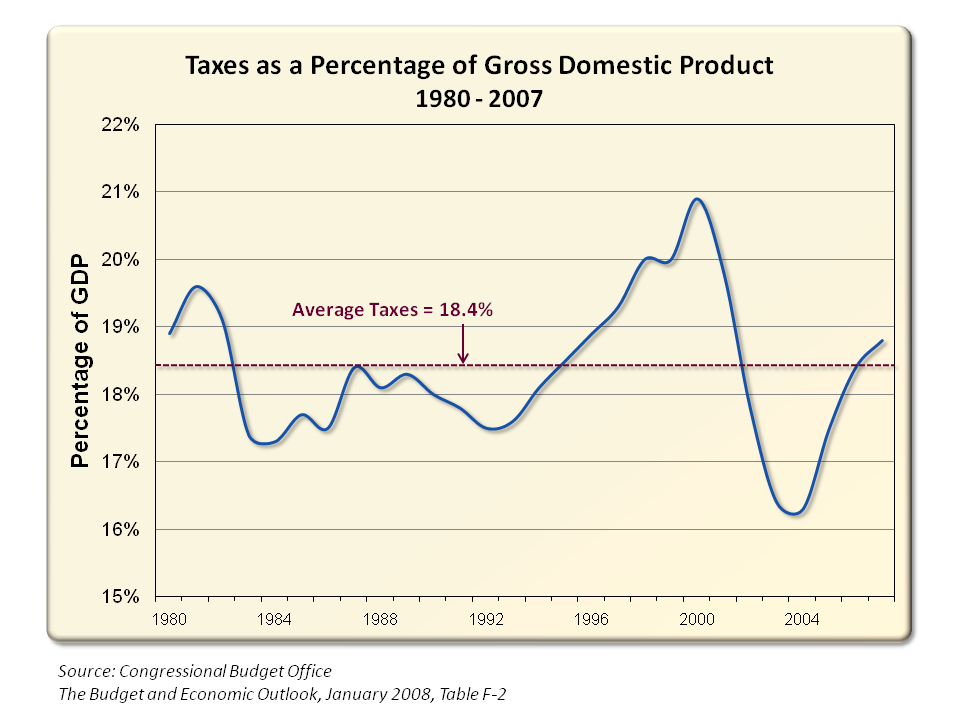
What really surprised me is how consistent the US economy has been for most the latter half of the 20th century: About 20% of GDP. It starts about 19%, peaks at about 23% then falls back to about 18 and a half%.
Note that this data is before the Bush’s Prescription Drug Act or Obama’s Health Care bill.

Federal Outlays, 1962 to 2001

(As a percentage of GDP)
Table


Chart


Charts via CBO, Perot Charts
More charts after the jump . . .


From Perot Charts:


>
Source:
A 125-Year Picture of the Federal Government’s Share of the Economy, 1950 to 2075
CBO, No. 1, June 14, 2002; Revised July 3, 2002 
http://www.cbo.gov/doc.cfm?index=3521&type=0

Atlanta Fed's Lockhart update

Fed's Lockhart: The U.S. Economy and Emerging Risks

From Atlanta Fed President Dennis Lockhart: The U.S. Economy and Emerging Risks. Lockhart reviews his general forecast for a modest U.S. recovery and then discusses risks from Greece (sovereign debt) and fiscal uncertainty - especially for U.S. states and local government:
There are other plausible emerging scenarios that are not factored into my formal outlook. I monitor these for evidence that they're materializing—becoming real—and need to be more formally considered. One such concern is what might be called "fiscal uncertainty."

You've all been reading about Greece and the European Union's handling of the Greek fiscal crisis. At the moment a nexus of fiscal uncertainty is the situation playing out in Greece.

Last October, the government of Greece revised its 2009 fiscal deficit sharply higher to more than 12 percent of GDP. Consequently, the ratio of public debt to GDP was revised up by 17 percentage points this year to 125 percent of GDP.

Investors around the world are concerned about Greece's deficit and rising debt. Market pressures, along with European Monetary Union mandates, have forced the government to present a credible plan to tame its deficit. As of today, how this will play out is not clear.

It's worth considering whether this is just a distant development or one with relevance to us here in the United States. What do fiscal problems in Greece have to do with my economic outlook for the United States?

I see three ways the Greek crisis might directly affect the U.S. economy. First, adjustment across the EU to fiscal problems could dampen euro area growth and constrain U.S. exports to that region. The European Union as a whole is this nation's largest export market. Second, related to this, safe haven currency flows from the euro into dollar assets could cause appreciation of the dollar and hurt U.S. export competitiveness. Third is the possibility that the Greek fiscal crisis could lead to a broad shock to financial markets. This could play out in the banking system or in the form of a general retreat from sovereign debt.

At this point, these possibilities are not factored into my outlook in any way. But developments around the Greek situation deserve rapt attention.

We have our own set of fiscal uncertainties in this country—at all levels of government. The National League of Cities projects that municipal governments will face a shortfall of $56 billion to $83 billion from 2010 to 2012. Local governments in this country are pressured by lower sales tax revenues and shrinking property tax digests along with other demands.

On average, state-level governments began fiscal year 2010 with a revenue-expenditure gap of 17 percent. Three states had expected budget gaps in excess of 40 percent. ...

Across the country, state governments have responded to these strains by drawing down rainy day funds, raising taxes, cutting budgets, and furloughing employees.

To date, some amount of spending cuts and tax increases at the state level have been avoided thanks to the federal stimulus package, but that infusion of money is temporary. It appears state budgets next year will need to shrink considerably to get to balance.

I'm sure you're familiar generally with the situation at the federal level. According to the Congressional Budget Office, under current law federal budget deficits rose from an average of about 2.4 percent of GDP in the period from 1970 to 2008 to 10 percent in 2009. No budget path currently under consideration would keep the public debt from growing relative to gross domestic product. Clearly, an ever-rising debt-to-GDP ratio is unsustainable and a matter of great concern.

Government finances are severely strained at all levels. All of these fiscal pressures represent another downside risk for the broad economy.
emphasis added
Earlier in his speech, Lockhart notes that "stabilization of the housing sector—especially house prices—is likely a precondition for sustained economic recovery". Housing is probably the major risk to Lockhart's view of a modest recovery.

Chicago Fed National Activity Index

Chicago Fed: Economic Activity index decreased in February

Note: This is a composite index based on a number of economic releases.

From the Chicago Fed: Index shows economic activity slowed in February
Led by declines in production-related indicators, the Chicago Fed National Activity Index decreased to –0.64 in February, down from –0.04 in January. Three of the four broad categories of indicators that make up the index deteriorated, and only the sales, orders, and inventories category made a positive contribution.

The index’s three-month moving average, CFNAI-MA3, decreased to –0.39 in February from –0.13 in January, but for the second consecutive month, it was higher than at any point since December 2007. February’s CFNAI-MA3 suggests that growth in national economic activity was below its historical trend.
...
Most of the weakness in the index continued to stem from the consumption and housing category. ... Employment-related indicators also made a negative contribution to the index, contributing –0.16 to the index in February compared with –0.02 in January.
Chicago Fed National Activity Index Click on table for larger image in new window.

This graph shows the Chicago Fed National Activity Index (three month moving average) since 1967. According to the Chicago Fed:
A CFNAI-MA3 value below –0.70 following a period of economic expansion indicates an increasing likelihood that a recession has begun. A CFNAI-MA3 value above –0.70 following a period of economic contraction indicates an increasing likelihood that a recession has ended. A CFNAI-MA3 value above +0.20 following a period of economic contraction indicates a significant likelihood that a recession has ended.
According to Chicago Fed, it is still too early to call the official recession over - but with the three month average CFNAI-MA3 above -0.70, the likelihood that a recession has ended is increasing.

Sunday, March 21, 2010

Our forecast : 25% further to fall on house prices

Follows from the price to rent, and the fact rents are following:

see:

Housing: Price-to-Rent Ratio

Here is an update on the price-to-rent ratio using the First Amercican CoreLogic price index released yesterday for house prices through January.

In October 2004, Fed economist John Krainer and researcher Chishen Wei wrote a Fed letter on price to rent ratios: House Prices and Fundamental Value. Kainer and Wei presented a price-to-rent ratio using the OFHEO house price index and the Owners' Equivalent Rent (OER) from the BLS.

The following graph uses the First American data ...

Price-to-Rent RatioClick on graph for larger image in new window.

This graph shows the price to rent ratio (January 2000 = 1.0).

This suggests that house prices are still a little too high on a national basis. But it does appear that prices are much closer to the bottom than the top.

Also, OER declined slightly again in February. The price index has declined 6 of the last 8 months, although most of the declines have been very small. With rents still falling, the OER index will probably continue to decline - pushing up the price-to-rent ratio.

Wednesday, March 17, 2010

Romer and Romer claim Fed's forecasts are good

http://elsa.berkeley.edu/wp/c+dromer_aer2000.pdf

Some previous FOMC forecasts

Some previous FOMC forecasts

This is just a reminder to take FOMC forecasts with a grain of salt.

First, the NBER determined that the great recession started in December 2007, and the FOMC met that same month - so we can see what they were thinking. The participant were aware that the incoming data was weakening, but their outlook was still for growth in 2008 and beyond ...

From the December 2007 FOMC Minutes:
In their discussion of the economic situation and outlook, participants generally noted that incoming information pointed to a somewhat weaker outlook for spending than at the time of the October meeting. The decline in housing had steepened, and consumer outlays appeared to be softening more than anticipated, perhaps indicating some spillover from the housing correction to other components of spending. These developments, together with renewed strains in financial markets, suggested that growth in late 2007 and during 2008 was likely to be somewhat more sluggish than participants had indicated in their October projections. Still, looking further ahead, participants continued to expect that, aided by an easing in the stance of monetary policy, economic growth would gradually recover as weakness in the housing sector abated and financial conditions improved, allowing the economy to expand at about its trend rate in 2009.
And here are the October projections mentioned in the December minutes:

FOMC Projections Click on graph for larger image in new window.

In October 2007, FOMC participants were forecasting GDP in the 2% range in 2008 with a return to trend growth in 2009, and the unemployment rate rising to perhaps 5%. How did that work out?

Of course this is nothing new. Here are a few quotes from Fed Chairman Alan Greenspan back in 1990 (bear in mind that the recession started in July, 1990):
“In the very near term there’s little evidence that I can see to suggest the economy is tilting over [into recession].” Greenspan, July 1990

“...those who argue that we are already in a recession I think are reasonably certain to be wrong.” Greenspan, August 1990

“... the economy has not yet slipped into recession.” Greenspan, October 1990
Of course I started marking my graphs with recession blue bars in January 2008 (I had luckily predicted the December start to the recession). Although my current view is for sluggish and choppy growth in 2010, there are still some downside risks - especially in the 2nd half of the year. Right now I think Q1 GDP growth will be sluggish, and the impact from the stimulus will fade over the year.