
Economists see signs of stronger recovery
'Sustained job creation ... will finally give Americans a tangible sense of an improving economy' in 2011, expert predicts
Below:
Among economists predicting a brighter 2011 are Mark Zandi, left, of Moody’s Economy.com; Phillip L. Swagel, center, a former Treasury economist; and Jan Hatzius of Goldman Sachs. By SEWELL CHAN
The New York Times
updated 12/24/2010 6:55:02 AM ET 2010-12-24T11:55:02
+-WASHINGTON — Eighteen months after the recession officially ended, the government’s latest measures to bolster the economy have led many forecasters and policy makers to express new optimism that the recovery will gain substantial momentum in 2011.
Economists in universities and on Wall Street have raised their growth projections for next year. Retail sales, industrial production and factory orders are on the upswing, and new claims for unemployment benefits are trending downward.
Despite persistently high unemployment, consumer confidence is improving. Large corporations are reporting healthy profits, and the Dow Jones industrial average reached a two-year high this week.
The Federal Reserve, which has kept short-term interest rates near zero since the end of 2008, has made clear it is sticking by its controversial decision to try to hold down mortgage and other long-term interest rates by buying government securities.
President Obama’s $858 billion tax-cut compromise with Congressional Republicans is putting more cash in the hands of consumers through a temporary payroll-tax cut and an extension of unemployment insurance for the long-term unemployed.
Tax incentives
It is also trying to address one of the biggest impediments to the recovery — the reluctance of companies to invest their piles of cash in new plants and equipment — by granting tax incentives for business investment.
The measured optimism is reminiscent of the mood a year ago, when the economy seemed to be reviving, only to stall again in the spring amid widespread fears caused by the debt crisis in Greece and other European countries.
.Even so, economists are increasingly upbeat about the outlook, saying that while the economy in 2011 will not be strong enough to drive unemployment down significantly, it should put the United States on its soundest footing since the financial crisis started an economic tailspin three years ago.
Phillip L. Swagel, who was the Treasury Department’s chief economist during the administration of George W. Bush and teaches at the University of Maryland, said, “The recovery in 2011 will be strong enough for us to see sustained job creation that will finally give Americans a tangible sense of an improving economy.”
..A prominent forecaster, Mark Zandi of Moody’s Economy.com, predicted that the economy would be “off and running” next year. “The policy response, in its totality, has been very aggressive,” he said, “and I think ensures that the recovery will evolve into a self-sustaining expansion early in 2011.”
The recession officially ended in June 2009, when the economy started to grow again. Gross domestic product, the broadest measure of the country’s output, grew at an annualized rate of 3.7 percent in the first quarter of this year. But then it stalled, with the rate falling to a mere 1.7 percent in the second quarter and 2.6 percent in the third quarter.
Jan Hatzius, the chief United States economist at Goldman Sachs, said the economy was likely to grow at an annualized rate of around 3 percent this quarter. Goldman projected last week that the growth rate would be 4 percent for most of 2011. Morgan Stanley, which raised its growth forecast for 2011 to 4 percent, is even more optimistic, forecasting a rate of 4.5 percent this quarter.
Administration officials, who have been burned by premature optimism in the past, were reluctant to make predictions for next year. But Austan D. Goolsbee, the chairman of the Council of Economic Advisers since September, said that a shift in sentiment quickly followed the news of the tax deal
“There aren’t many policies which, on the day Washington announces them, lead most private-sector forecasters to publicly and significantly revise their forecasts upward,” he said. “This one did.”
Video: A promising Christmas shopping season wraps up (on this page)
There are significant caveats to the more positive outlook. The housing market remains weak, and another sustained drop in prices could badly undercut the economy. Financial markets and the banking system remain vulnerable to a new round of jitters in Europe over the debt burdens of countries like Ireland and Spain. There is mounting concern about the tattered balance sheets of state and local governments.
While fiscal and monetary policy seems to be helping the economy in the short turn, the tax-cut compromise essentially deferred looming battles over how to cut federal spending and address the government’s huge debt burden.
The Fed’s bond-buying efforts have not prevented long-term interest rates from rising — a phenomenon that is interpreted by optimists as a reaction to higher growth and by pessimists as a demonstration of the ineffectiveness of the central bank’s efforts and the potential for inflation.
And for most of the roughly eight million Americans who have lost their jobs since the recession began in December 2007, it hardly feels like a recovery.
..The unemployment rate remains at its highest level since the early 1980s; it rose to 9.8 percent this month and is likely to remain above 9 percent through all of next year, confirming the view that the United States is in another jobless recovery like the ones that followed the last two recessions, in 1990-91 and in 2001.
“Historically, unemployment rates come down slowly, so even with 4 percent growth, you would expect to see the unemployment rate come down maybe a percentage point a year, probably less,” said Alan B. Krueger, who was the Treasury Department’s top economist until last month when he returned to Princeton. “Given how high the unemployment rate is, that’s going to seem very slow.”
Robert J. Gordon, an economist at Northwestern University and a member of the committee that sets the start and end dates of business cycles, cautioned against excessive optimism, noting the huge burdens on state and local governments, rising costs of health care and other long-run fiscal challenges. “The rise of the stock market is mainly because there are no other good investments in sight, not because the stock market has some unique talent in predicting what’s wrong with the economy.”
N. Gregory Mankiw, a Harvard economist who was chairman of the White House Council of Economic Advisers under Mr. Bush, said that “anything that spooks consumers and businesses from spending” could threaten the recovery, including “a worsening of the fiscal crisis in Europe or the increased fear that a similar crisis will soon infect U.S. cities and states.”
The Fed is likely to end its $600 billion bond-buying program in mid-2011, meaning monetary policy might be providing less of a kick to the economy by the end of the year. Officials in the Obama administration also seem to agree that after the $787 billion stimulus last year and the $858 billion tax-cut compromise just approved by Congress, the government’s arsenal of fiscal tools has just about been used up.
'Business angst is dropping'
“We went through a year and a half period, at least, with the private sector in free fall and government taking a much more significant role than anybody in normal times would want,” said Mr. Goolsbee. “And the president’s oft-repeated view is that we don’t want to be in that circumstance forever — the government should not be the primary driver of long-run growth in the country. We’ve got to have the private sector stand up.”
Representative Kevin Brady of Texas, the top Republican on the Joint Economic Committee of Congress, said he believed his party’s gains in the midterm elections had bolstered consumer and business confidence, arguing that Republicans have advocated fiscal discipline and opposed onerous regulations and tax increases.
“Consumer confidence seems to be on the upswing and business angst is dropping,” he said. “It hasn’t swung into the confidence column yet, but the negativity is lowering.”
This story, " Economists See Signs of Stronger Recovery," originally appeared in The New York Times.

Friday, December 24, 2010

Thursday, December 9, 2010
Livingston Survey Downgrades Economic Forecast – 12/9/10
Livingston Survey Downgrades Economic Forecast
Posted on 9 December 2010 by Steven Hansen
The semi-annual Livingston Survey was just released by the Philly Fed. The Livingston Survey was started in 1946 by the late columnist Joseph Livingston. It is the oldest continuous survey of economists’ expectations. It summarizes the forecasts of economists from industry, government, banking, and academia.
 Summary of the Economic Projections:
The 33 participants in the December Livingston Survey see modest output growth through 2011. The forecasters, who are surveyed by the Federal Reserve Bank of Philadelphia twice a year, project that the economy’s output (real GDP) will rise at an annual rate of 2.3 percent during the second half of 2010. Moreover, output is expected xpected to grow 2.5 percent (annual rate) in the first half of 2011, followed by growth of 2.9 percent (annual rate) in the second half of 2011. The current projection for growth in the second half of 2010 was lowered one full percentage point from the survey of six months ago, while the forecast for the first half of 2011 was lowered 0.5 percentage point.
The panelists expect to see a slow recovery in the labor market, with the unemployment rate at 9.6 percent in December 2010 and at 9.4 percent in June 2011. These estimates represent increases of 0.1 and 0.3 percentage point, respectively, from the survey of six months ago. The unemployment rate is then expected to fall slightly lower, to 9.2 percent in December 2011.
Econintersect presents forecasts without analysis unless there is an obvious deviation from other forecasts. In this case, the forecasts are roughly similar to the Federal Reserve’s (see analysis here). One table from the Fed’s forecast is shown below.

Tables From the Livingston Survey:
 The survey itself has many more projections on CPI. earnings, retail trade, housing, industrial production, autos – and some breakdown of GDP elements.
Wednesday, December 1, 2010
Transcript: 415 The Greenspan put expires with the economy out on a limb
Listen to this episode
We were somewhat taken aback this week when Calculated Risk, one of the people we rely on most for data and analysis -- find him at CalculatedRisk.com -- opined that things were getting better. Our view at Demand Side, as you know, is and has been that things are bouncing along the bottom with significant downside risks for another crisis.
We'll look today at what CR sees, and then we'll offer a little pushback from an important piece from an another anonymous but very influential analyst. We'll also get to the economic models that worked, from a paper by Dirk J. Bezemer, Groningen University, and get some audio from the always pungent and perspicatious Steve Keen, whose accounting framework modeling is the cutting edge.
That from the mysterious Calculated Risk. Not so different from our bouncing along the bottom with downside risks, except CR seems very willing to extrapolate the bump in good news. We are not. And for some of the reasons why, we yield to another anonymous voice:
Ananomen Analyst is a wealth manager associated with a major Wall Street investment bank who uses a pseudonym to avoid any incorrect implication that his views might reflect those of his firm.
Writing under the head "The Greenspan Put Expires Worthless in the Eye of the Hurricane" courtesy of EconIntersect.com
We can add our own:
Deteriorating infrastructure
Failing educational system
Climate change
Well, that was so much fun we didn't get to the important analysis on why the mainstream economists missed the biggest economic event in half a century. The Queen had the right question, "If this was so big, why did nobody see it coming?" We'll answer that question on our next podcast.
We were somewhat taken aback this week when Calculated Risk, one of the people we rely on most for data and analysis -- find him at CalculatedRisk.com -- opined that things were getting better. Our view at Demand Side, as you know, is and has been that things are bouncing along the bottom with significant downside risks for another crisis.
We'll look today at what CR sees, and then we'll offer a little pushback from an important piece from an another anonymous but very influential analyst. We'll also get to the economic models that worked, from a paper by Dirk J. Bezemer, Groningen University, and get some audio from the always pungent and perspicatious Steve Keen, whose accounting framework modeling is the cutting edge.
Sunday, November 28, 2010
The recent improvement in economic news
by CalculatedRisk
It is worth noting the recent improvement in economic news:
• The October employment report showed a gain of 151,000 nonfarm payroll jobs, the most since April ex-Census. Expectations are for a similar gain in November, although probably not enough jobs added to push down the unemployment rate.
• The BEA estimated real GDP grew at a 2.5% annual rate in Q3. This is still sluggish, but an improvement from the 1.7% growth rate in Q2.
• The Personal Income and Outlays report for October indicated incomes grew at a 0.5% rate (month-to-month), and it appears PCE has grown at about a 3% annualized rate over the last three months. The personal saving rate was 5.7% in October, and although I expect the rate to increase a little more - it appears a majority of the adjustment is behind us (a rising saving rate is a drag on personal consumption).
• The 4-week average of initial weekly unemployment claims has declined to 436,000 last week from over 480,000 at the end of August. The weekly reading was 407,000 last week; the lowest since July 2008.
• Most regional manufacturing surveys, with the exception of the NY Fed survey (empire state), has shown a pickup in manufacturing. This suggests the manufacturing sector is still improving (the ISM manufacturing index for November will be released on Wednesday).
• Trucking and rail traffic improved in October, although the Ceridian diesel fuel index was weak.
• The Architecture Billings Index (a leading indicator for commercial real estate) is near flat - suggesting investment in commercial structures such as hotels, offices and malls will stop contracting next year. (addition by subtraction!)
• Even small business optimism has improved slightly.
Most of the reasons for the recent slowdown are still with us - less stimulus spending, the end of the inventory adjustment, problems in Europe and a slowdown in China, and cutbacks at the state and local level - but it appears Residential investment (RI) has bottomed and will most likely add to GDP growth in 2011. I believe the RI drag is now behind us, and RI is usually the best leading indicator for the economy.
The data is still mixed and fits with my general view of a sluggish and choppy recovery (my view since the spring of 2009). Although I don't see a sharp increase in growth, I think the pace of recovery will probably pick up a little bit in 2011, and I'll take the over on the consensus view of 2.5% GDP growth in 2011. My guess is 3%+ GDP growth in 2011 - still not a strong recovery given the amount of slack in the economy, but an improvement over 2010.
Unfortunately there probably will not be enough growth to significantly reduce the unemployment rate in 2011.
Note: I'll add more before the end of the year, but I've been sharing my thoughts with a few analysts and economic commentators and I try to post my views whenever they change - even a little. Right now it looks like the "slowdown, but no double dip call" was correct (it is still early), and now I'm becoming a little more optimistic and taking the "over" on 2011 GDP growth (still no v-shape recovery though).
That from the mysterious Calculated Risk. Not so different from our bouncing along the bottom with downside risks, except CR seems very willing to extrapolate the bump in good news. We are not. And for some of the reasons why, we yield to another anonymous voice:
Ananomen Analyst is a wealth manager associated with a major Wall Street investment bank who uses a pseudonym to avoid any incorrect implication that his views might reflect those of his firm.
Writing under the head "The Greenspan Put Expires Worthless in the Eye of the Hurricane" courtesy of EconIntersect.com
The Fed Used to be Important: The Greenspan Put
For many years our writing has been focused on the Federal Reserve, since monetary policy easily has the largest influence on the economy and financial markets. Since World War II, every recession was preceded by a tightening of monetary policy and higher interest rates, and every recovery spurred by lower rates and an easing of monetary policy. Every cyclical bear market and bull market was also strongly influenced by changes in monetary policy. Since the stock market crash in 1987 and the 1998 collapse of Long Term Capital Management, investors have believed the Federal Reserve also possessed the capacity to manage every crisis. Since those two crises occurred when Alan Greenspan was Chairman and Maestro of the Federal Reserve, it became known as the ‘Greenspan Put’. This reference to the value of a put option during a market decline, increased investors bravado that they needn’t worry about a negative Macro event, since the Fed would simply exercise ‘Greenspan’s Put’ and restore order.
The current financial crisis has exposed numerous fissures in the U.S. economic foundation, which will be addressed later. More importantly, it has shown that the Federal Reserve no longer possesses the capacity to manipulate economic activity, as they did during the last 60 years. The balance of power has shifted from the Federal Reserve being proactive and exerting a strong controlling influence on the economy, to one of being reactive. The Fed can now only indirectly affect the numerous drags on economic growth, despite an unprecedented level of monetary accommodation. This change in the balance of power, from the Federal Reserve being proactive to reactive is significant, since it means ‘Greenspan’s Put’ has expired.
The majority of mutual fund managers, market strategists, economists, and investors have not yet realized that this shift in control and power has occurred. Their continued faith in ‘Greenspan’s Put’ may cost them dearly in the next few years, as the Federal Reserve struggles to keep the credit bubble from deflating.
The Eye of the Hurricane
The financial crisis that kicked off in August 2007 has never really ended. Much like a Category 5 hurricane, the global economy was battered by the outer wall as it came ashore in 2008 and early 2009. The eye was created, as every central bank adopted an extraordinary level of monetary accommodation. Governments around the world launched massive fiscal stimulus programs that resulted in historic budget deficits in almost all of the developed countries. In the United States, the eye of the hurricane allowed GDP to grow, but at a sub-par pace. Compared to the recession of 1973-1974, the first five quarters of GDP growth since the summer of 2009 have averaged 2.8, half as fast as the first five quarters after the 1973-1974 recession. The first five quarters after the deep 1981-1982 recession averaged GDP growth of 8.4%, three times the strength of this recovery.
There are a number of indications that suggest we will be moving out of the hurricane’s eye sometime in the next six months. Most of the Federal fiscal stimulus has been spent, without launching a self-sustaining recovery. Job growth has been exceptionally weak when compared to other post World War II recoveries. Without a healthy increase in disposable income, consumer spending will not elevate GDP growth above 3% on a sustainable basis. The only way that will occur is if solid job growth of 300,000 jobs per month kicks in, and that’s not likely anytime soon. Spending may marginally pick up during the holidays. Keeping a rein on spending gets old after a while and the holidays are a good reason to loosen up a bit. Unfortunately, millions of unemployed workers will see their unemployment benefits expire, unless Congress extends them, which we expect. However, that will only make cutting the Federal budget deficit more of a challenge.
State legislators do have to balance their budgets and they will be raising taxes and fees, and laying off more state workers. Housing prices are set to fall further, as more than 70% of homes in foreclosure have yet to hit the market.
In Europe, the eye of the hurricane resulted in a very uneven pick-up in economic growth. Although Germany has done well, actually recovering all of the ground lost during 2008, many other countries have not fared well. Ireland and Greece are still contracting, while unemployment in Spain is almost 20%. European banks are in worse shape than their U.S. counterparts. Although we expect the European Union to bail out Ireland’s banks, the credit crisis is likely to eventually engulf Spain. This will prove significant since Ireland and Greece combined represents just 5% of total E.U. GDP, while Spain represents 10%.
In response to the global slowdown in 2008, China initiated a $570 billion stimulus package, and ordered state run banks to lend aggressively. In 2009, Chinese banks increased lending by $1 trillion, an enormous amount given the size of China’s economy, $4.5 trillion. The combination of fiscal and monetary stimulus had the desired effect of boosting China’s economy, but has also resulted in a burst of inflation in 2010. In October, official consumer prices were up 4.4% from year ago levels. The real inflation rate in China could be at least twice as high. China has not revised its CPI since 1993, and the weighting of many food components are not realistic. According to official government data, food prices have risen just 19% over the last three years, but over that period, rice was up 38%, wheat up 35%, and beef and milk prices rose 44%. In contrast, two major supermarkets reported that rice prices had soared by 132% and 190% over the last three years.
In response, China’s central bank has raised its lending rate and bank reserve requirements. Rising inflation isn’t just limited to China, but to most of the Asian countries, which have been enjoying solid growth. South Korea had increased rates once, but Australia has boosted its bank cash-rate seven times from its 2009 low of 3.0% to 4.75%. India has hiked its repo rate six times to 6.25% from 4.75% in early 2010. Inflationary pressures are likely to intensify, since the output gap between capacity and production have disappeared in India, South Korea, China and Indonesia, according to the Royal Bank of Scotland. This makes it easier for companies to raise their prices. These are the countries with the strongest growth, but the gradual tightening of monetary policy will likely result in a slow down during 2011.
As the back wall of the hurricane approaches the global economy with its Category 5 winds, investors will realize that most of the problems that emerged in 2008 were not solved or fully addressed. The macro tides which lifted the global economy for decades have shifted. Investors will have to focus on preservation of capital in 2011, and batten down the hatches.
Components of the Macro Tides
The following is a list of individual headwinds. Each will weigh on growth in the U.S., keep GDP growth from reaching a self-sustaining level, and cause GDP growth to average under +2.0% in coming quarters. This list will provide a worksheet that will allow us to monitor which headwinds are deteriorating or improving. At some point in the future, the majority of these headwinds will begin to improve and help identify when another eye in this extended hurricane is approaching. Many are interconnected and there is some overlap. The most important common denominator is that solid economic growth will address most of these issues. Adopting policies that will strengthen economic growth is imperative. However, there are no easy choices since there are potential negative outcomes associated with every option. We’re in quite a fix. One, even Houdini would struggle with:
¦ The ratio of total debt to total GDP in the U.S.
¦Monetary policy impotence
¦Finding a short and long term solution for the federal budget deficit
¦Recapitalizing the US banking system, so lending broadly resumes
¦Weak job and disposable income growth
¦The change in middle class spending psychology toward less is more
¦Stabilizing housing despite the large overhang of foreclosed homes
¦Commercial property rents and values
¦Dealing with state budget deficits
¦The demographic shift of baby boomers into retirement
¦Social security
¦Addressing the income inequality gap between the top 1% and average worker’s pay
¦The lack of true leadership from either political party
¦The cost of health care rising faster than personal income
¦Medicare
¦The unintended fallout from financial regulatory reform
¦Deflation
¦Inflation
¦Protectionism
¦The European sovereign debt problems
¦Recapitalizing European banks
¦The global economic drag from closing fiscal budget deficits in developed countries
¦Keeping Israel and other middle eastern countries from starting another war
¦China and its currency and trade policies
¦China’s potential bank loan defaults from excess export capacity
¦The Basil increased requirements for international bank capital by 2020
¦The unanticipated
We can add our own:
Deteriorating infrastructure
Failing educational system
Climate change
Well, that was so much fun we didn't get to the important analysis on why the mainstream economists missed the biggest economic event in half a century. The Queen had the right question, "If this was so big, why did nobody see it coming?" We'll answer that question on our next podcast.
Sunday, November 28, 2010
The Greenspan Put Expires Worthless in the Eye of the Hurricane
The Greenspan Put Expires Worthless in the Eye of the Hurricane
Posted on 28 November 2010 by adminGuest Author: Ananomen Analyst is a wealth manager associated with a major Wall Street investment bank who uses a pseudonym to avoid any incorrect implication that his views might reflect those of his firm. Ananomen Analyst publishes a monthly subscription newsletter, Macro Tides. This article was taken from the November issue. Enquiries can be made at MacroTides@macrotides1@gmail.comIn September 2007 we used the metaphor of a tsunami to describe the convulsion that had swept through the credit markets in August 2007. In just seven days, 90-day Treasury bill yields plunged from 4.9% to 2.5%, and within a month, the $2.2 trillion commercial paper market contracted 15%. The sheer magnitude of these dislocations left little doubt that a significant seismic event had occurred, providing a clear foreshadowing of events to come. In August 2008, it was noted the perception of a tsunami is a single giant wave of water that sweeps away everything in its path once it reaches land. In fact, a tsunami is actually a series of giant waves, each one causing more destruction. Within weeks of writing those words, Lehman Brothers would fail, unleashing the largest wave of financial destruction that has reshaped the global financial landscape. It also exposed numerous fissures in the economic foundation of the U.S. and global economy that had been building for decades.
Changing Banking Business Model
In late 2007, we discussed how the business model of the large banks had evolved over the prior 25 years. Rather than holding a car loan or mortgage loan on their books, banks had increasingly relied on the capacity of Wall Street to securitize their lending. This allowed banks to effectively leverage their capital base by moving loans off their balance sheet. By doing so, they could increase lending and increase origination fees on a larger volume of lending, without a corresponding increase in their capital base. By 2007, traditional bank lending was providing 35% of total credit creation, while securitized credit creation was 40%, according to BCA Research. This new business model, however, was dependent on market provided financing, which the banks incorrectly assumed would always be available. As liquidity dried up in the second half of 2007, banks found their balance sheets bloated with $400 billion of “temporary” bridge loans to private equity, and a more challenging credit market environment.
The change in the bank business model has also had a profound impact on the effectiveness of monetary policy. When banks were providing 75% of credit creation, the Federal Reserve’s leverage on the economy was significant. By increasing or lowering interest rates, the Fed would immediately impact the cost of credit to a broad cross section of the U.S. economy, including housing, automobile purchases, and business inventory financing. However, as the amount of bank credit creation shriveled from 75% to 35% of total credit creation, so did the Federal Reserve’s leverage on the economy. As we have seen, the Federal Reserve has lowered the Federal funds rate to nearly 0%, and it doesn’t provide much of a lift for the economy.
This Time It’s Different
As we wrote in December 2007, the Fed’s diminished leverage on the economy through the banking system is why this crisis was likely to be quite different than the other crises faced by the Federal Reserve during the prior 20 years. Most mutual fund managers are ‘bottoms up’ stock pickers, who primarily focus on individual company balance sheets, or a specific sector, i.e. small cap, mid cap, etc. Given their approach, they spend very little time on the ‘macro’ side of the ledger. They also don’t understand the credit creation process. They didn’t see the last crisis coming, and they won’t see the next one either, since that’s not where their focus is oriented. As a result, they didn’t comprehend the scope of the crisis, and the Fed’s limited ability to deal with it. As we said in December 2007, “It really is different this time.”
Expectations for QE2
A further indication of how few market strategists, economists, and policy makers grasp the big picture is how many of them reacted to the Fed’s announcement of QE2. In one corner, are those who have sharply criticized the decision through editorials, and statements by a number of Federal Reserve Board district presidents. A group of prominent Republican leaning economists and lawmakers are even running ads in the Wall Street Journal and New York Times.
“The planned asset purchases risk currency debasement and inflation, and we do not think they will achieve the Fed’s objective of promoting employment.”Reaction from overseas has been even more strident. The German Finance Minister astutely observed,
“It doesn’t add up when the Americans accuse the Chinese of currency manipulation and then artificially lower the value of the dollar.”The Brazilian finance Minister said
“It will lead to greater disequilibrium in the world markets”.And Brazil’s new president volunteered an interesting reference
“The last time there was a competitive devaluation of currencies it ended up where it did, in the Second World War.”Over the last two months, the financial markets have weighed in with their opinion by rallying almost non-stop in anticipation of the Fed’s November 3 official announcement. The expectation is that QE2 will be the Red Bull for a faltering recovery that needs something to become rejuvenated. Investors have also inferred that a secondary goal of QE2 is to boost asset values, and stock and raw material traders have been more than happy to oblige the Fed.
QE2 in the U.S. Economy: Not Much Effect
Our take has been that QE2 will not provide much benefit to the economy, and those who think it will are naïve. The reports of inflation’s imminent arrival are greatly exaggerated. The 30-year average for Capacity Utilization is just under 81.0%. In October, the utilization rate was 74.7%. With an output gap that large, most companies have virtually no pricing power. So they will be forced to swallow most of the recent increase in raw material prices, which will cut into their profit margins. The unemployment rate is 9.7%, the underemployment rate is near 17%, and there are 5 workers for every 1 job opening. Wage gains have been stagnant, and given the dynamics of the labor market, wages are more likely to remain under pressure for years. Since wages comprise 65% of the cost of goods, the risk of persistent inflation is negligible. The recent run up in food and energy prices is a different kind of inflation, since it reduces disposable income. The more consumers spend on energy and food, the less they have to spend on everything else. Less disposable income in a weak economic environment adds an element of deflation, along with its measure of inflation.

With all the negative publicity and concern about bubbles, poor Lawrence Welk must be truly perplexed. As we have often noted since 2007, the one bubble the Federal Reserve cannot allow to deflate is the credit bubble, so let’s review it again. For each $1.00 of GDP, there is $3.70 of debt that economic growth must support. If economic growth doesn’t throw off enough cash flow to support that mountain of debt, debt defaults will accelerate. In total, GDP of $14 trillion is supporting $50 trillion of debt. Layered on top of this debt load is another $30 trillion to $50 trillion of debt based derivatives (rough guess). The Fed’s QE2 program of $600 billion looks inadequate to insure the credit bubble will not deflate, especially if GDP growth is too slow or housing and stock prices decline again.
The Fed Used to be Important: The Greenspan Put
For many years our writing has been focused on the Federal Reserve, since monetary policy easily has the largest influence on the economy and financial markets. Since World War II, every recession was preceded by a tightening of monetary policy and higher interest rates, and every recovery spurred by lower rates and an easing of monetary policy. Every cyclical bear market and bull market was also strongly influenced by changes in monetary policy. Since the stock market crash in 1987 and the 1998 collapse of Long Term Capital Management, investors have believed the Federal Reserve also possessed the capacity to manage every crisis. Since those two crises occurred when Alan Greenspan was Chairman and Maestro of the Federal Reserve, it became known as the ‘Greenspan Put’. This reference to the value of a put option during a market decline, increased investors bravado that they needn’t worry about a negative Macro event, since the Fed would simply exercise ‘Greenspan’s Put’ and restore order.
The current financial crisis has exposed numerous fissures in the U.S. economic foundation, which will be addressed later. More importantly, it has shown that the Federal Reserve no longer possesses the capacity to manipulate economic activity, as they did during the last 60 years. The balance of power has shifted from the Federal Reserve being proactive and exerting a strong controlling influence on the economy, to one of being reactive. The Fed can now only indirectly affect the numerous drags on economic growth, despite an unprecedented level of monetary accommodation. This change in the balance of power, from the Federal Reserve being proactive to reactive is significant, since it means ‘Greenspan’s Put’ has expired.
The majority of mutual fund managers, market strategists, economists, and investors have not yet realized that this shift in control and power has occurred. Their continued faith in ‘Greenspan’s Put’ may cost them dearly in the next few years, as the Federal Reserve struggles to keep the credit bubble from deflating.
Macro Tides
Everyone is familiar with the phrase “A rising tide lifts all ships.” But the tides also come in and go out. For most of the last 65 years, the tide has been coming in and rising for the U.S. economy. During this period, the macro tides underpinning the U.S economy were supportive of economic growth, which raised the living standards of most Americans. As discussed in September, the U.S. was in recession just 64 months of the 300 months between 1957 and 1982. Despite this enviable record, those in control of Congress in 1978 passed the “Full Employment and Balanced Growth Act.” The Act mandated that the Federal Reserve utilize an ongoing monetary policy that strived for full employment, growth in production, price stability, balance of trade, and balancing the Federal budget.
Balance the Federal budget? This item is a Congressional classic since the Constitution places the full responsibility for balancing the Federal budget on Congress. But members of Congress from both parties have rarely ducked an opportunity to shirk responsibility. Passing legislation that absolves Congress of fiscal responsibility is a lot better excuse than my dog ate my homework. In the 300 months between 1982 and 2007, the economy was in recession only 16 months, so the combination of liberal monetary policy and the lack of fiscal discipline appeared a great success. Unfortunately, a number of large imbalances developed during the 25 years of policy ‘success’ topped off with a financially engineered housing bubble.
The implosion of the housing bubble has exposed a significant number of fault lines that were hidden, as long as the credit bubble was expanding and debt driven GDP growth exceeded 3.0% on average. The Federal Reserve is no longer ahead of the economic curve. Instead, they are using every conventional and unconventional policy tool available just to keep the economy growing. Their primary goal is to buy time, and hopefully enough time for all the healing needed. However, they are pushing against a number of macro tides, both large and small, that will continue to weigh on economic growth in the U.S. and globally for at least the next 2 to 3 years.
The Eye of the Hurricane
The financial crisis that kicked off in August 2007 has never really ended. Much like a Category 5 hurricane, the global economy was battered by the outer wall as it came ashore in 2008 and early 2009. The eye was created, as every central bank adopted an extraordinary level of monetary accommodation. Governments around the world launched massive fiscal stimulus programs that resulted in historic budget deficits in almost all of the developed countries. In the United States, the eye of the hurricane allowed GDP to grow, but at a sub-par pace. Compared to the recession of 1973-1974, the first five quarters of GDP growth since the summer of 2009 have averaged 2.8, half as fast as the first five quarters after the 1973-1974 recession. The first five quarters after the deep 1981-1982 recession averaged GDP growth of 8.4%, three times the strength of this recovery.

There are a number of indications that suggest we will be moving out of the hurricane’s eye sometime in the next six months. Most of the Federal fiscal stimulus has been spent, without launching a self-sustaining recovery. Job growth has been exceptionally weak when compared to other post World War II recoveries. Without a healthy increase in disposable income, consumer spending will not elevate GDP growth above 3% on a sustainable basis. The only way that will occur is if solid job growth of 300,000 jobs per month kicks in, and that’s not likely anytime soon. Spending may marginally pick up during the holidays. Keeping a rein on spending gets old after a while and the holidays are a good reason to loosen up a bit. Unfortunately, millions of unemployed workers will see their unemployment benefits expire, unless Congress extends them, which we expect. However, that will only make cutting the Federal budget deficit more of a challenge.

State legislators do have to balance their budgets and they will be raising taxes and fees, and laying off more state workers. Housing prices are set to fall further, as more than 70% of homes in foreclosure have yet to hit the market.

In Europe, the eye of the hurricane resulted in a very uneven pick-up in economic growth. Although Germany has done well, actually recovering all of the ground lost during 2008, many other countries have not fared well. Ireland and Greece are still contracting, while unemployment in Spain is almost 20%. European banks are in worse shape than their U.S. counterparts. Although we expect the European Union to bail out Ireland’s banks, the credit crisis is likely to eventually engulf Spain. This will prove significant since Ireland and Greece combined represents just 5% of total E.U. GDP, while Spain represents 10%.
In response to the global slowdown in 2008, China initiated a $570 billion stimulus package, and ordered state run banks to lend aggressively. In 2009, Chinese banks increased lending by $1 trillion, an enormous amount given the size of China’s economy, $4.5 trillion. The combination of fiscal and monetary stimulus had the desired effect of boosting China’s economy, but has also resulted in a burst of inflation in 2010. In October, official consumer prices were up 4.4% from year ago levels. The real inflation rate in China could be at least twice as high. China has not revised its CPI since 1993, and the weighting of many food components are not realistic. According to official government data, food prices have risen just 19% over the last three years, but over that period, rice was up 38%, wheat up 35%, and beef and milk prices rose 44%. In contrast, two major supermarkets reported that rice prices had soared by 132% and 190% over the last three years.
In response, China’s central bank has raised its lending rate and bank reserve requirements. Rising inflation isn’t just limited to China, but to most of the Asian countries, which have been enjoying solid growth. South Korea had increased rates once, but Australia has boosted its bank cash-rate seven times from its 2009 low of 3.0% to 4.75%. India has hiked its repo rate six times to 6.25% from 4.75% in early 2010. Inflationary pressures are likely to intensify, since the output gap between capacity and production have disappeared in India, South Korea, China and Indonesia, according to the Royal Bank of Scotland. This makes it easier for companies to raise their prices. These are the countries with the strongest growth, but the gradual tightening of monetary policy will likely result in a slow down during 2011.

As the back wall of the hurricane approaches the global economy with its Category 5 winds, investors will realize that most of the problems that emerged in 2008 were not solved or fully addressed. The macro tides which lifted the global economy for decades have shifted. Investors will have to focus on preservation of capital in 2011, and batten down the hatches.
Components of the Macro Tides
The following is a list of individual headwinds. Each will weigh on growth in the U.S., keep GDP growth from reaching a self-sustaining level, and cause GDP growth to average under +2.0% in coming quarters. This list will provide a worksheet that will allow us to monitor which headwinds are deteriorating or improving. At some point in the future, the majority of these headwinds will begin to improve and help identify when another eye in this extended hurricane is approaching. Many are interconnected and there is some overlap. The most important common denominator is that solid economic growth will address most of these issues. Adopting policies that will strengthen economic growth is imperative. However, there are no easy choices since there are potential negative outcomes associated with every option. We’re in quite a fix. One, even Houdini would struggle with:
- The ratio of total debt to total GDP in the U.S.
- Monetary policy impotence
- Finding a short and long term solution for the federal budget deficit
- Recapitalizing the US banking system, so lending broadly resumes
- Weak job and disposable income growth
- The change in middle class spending psychology toward less is more
- Stabilizing housing despite the large overhang of foreclosed homes
- Commercial property rents and values
- Dealing with state budget deficits
- The demographic shift of baby boomers into retirement
- Social security
- Addressing the income inequality gap between the top 1% and average worker’s pay
- The lack of true leadership from either political party
- The cost of health care rising faster than personal income
- Medicare
- The unintended fallout from financial regulatory reform
- Deflation
- Inflation
- Protectionism
- The European sovereign debt problems
- Recapitalizing European banks
- The global economic drag from closing fiscal budget deficits in developed countries
- Keeping Israel and other middle eastern countries from starting another war
- China and its currency and trade policies
- China’s potential bank loan defaults from excess export capacity
- The Basil increased requirements for international bank capital by 2020
- The unanticipated
Stocks
As discussed in October, investors have become hopeful that QE2 and a new batch of Republicans in Congress will give the economy a lift. In recent weeks, investor sentiment has become even more bullish. Last week, the percent of bulls in Investors Intelligence’s weekly survey reached 56.2%, the highest since October 2007. Two weeks ago, the percent of bulls in Consensus’ weekly survey was the highest since last April, just before the April 2010 high was put in, and the 10-day call/put ratio also reached its highest level since April, just as the S&P pushed slightly above its April high at 1219.
The high level of bullishness is a warning that the market is near an important price high. A resolution to the Irish banking problem should provide the market a lift. With year-end approaching, trading will likely be choppy, but another push above the November high at 1227 is likely. It’s time for investors to become more defensive and sell into strength, especially if the S&P exceeds 1227.
Bonds
In October Treasury bonds were vulnerable to a sell-off, due to investors’ faith that QE2 would work in spurring the economy. The 10-year treasury yield has risen from 2.5% to almost 3.0%. The 10-year Treasury yield is likely to remain range bond between 2.5% and 3.2% for months.
Dollar
If I’m right about a resumption of the credit crisis in 2011, the Dollar will experience a flight to a quality rally that should lift the Dollar index to the range 88.00 to 92.00.
Gold
As long as gold holds above $1310, the major trend is up. A rebound to $1375 is likely.
Historical Perspective
We close with a view of how things currently compare to the recent decades. The charts below provide a good look at 43 years of history.

Calculated Risk: Data for week ending 11/27
Sunday, November 28, 2010
A Summary for Week ending November 27th
by CalculatedRisk on 11/28/2010 09:10:00 AM
Below is a summary of last week mostly in graphs.
Here is the economic schedule for the coming week.
Note: A key story has been the rescue of Ireland. The Irish Times reports that a deal is done, but the details haven't been released.
• New Home Sales declined in October  Click on graph for larger image in graph gallery.
This graph shows New Home Sales vs. recessions for the last 47 years. The dashed line is the current sales rate.
The Census Bureau reported New Home Sales in October were at a seasonally adjusted annual rate (SAAR) of 283 thousand. This is down from 308 thousand in September. "This is 8.1 percent below the revised September rate ... and is 28.5 percent below the October 2009 estimate of 396,000."  Months of supply increased to 8.6 in October from 7.9 in September. The all time record was 12.4 months of supply in January 2009. This is still high (less than 6 months supply is normal).
The 283 thousand annual sales rate for October is just above the all time record low in August (275 thousand). This was the weakest October on record and well below the consensus forecast of 314 thousand.
• October Existing Home Sales: 4.43 million SAAR, 10.5 months of supply
The NAR reports: Existing-Home Sales Decline in October Following Two Monthly Gains  This graph shows existing home sales, on a Seasonally Adjusted Annual Rate (SAAR) basis since 1993.
Sales in October 2010 (4.43 million SAAR) were 2.2% lower than last month, and were 25.9% lower than October 2009.
The next graph shows the year-over-year (YoY) change in reported existing home inventory and months-of-supply. Inventory is not seasonally adjusted, so it really helps to look at the YoY change.  Although inventory decreased from September 2010 to October 2010, inventory increased 8.4% YoY in October. This is the largest YoY increase in inventory since early 2008.
The year-over-year increase in inventory is especially bad news because the reported inventory is very high (3.864 million), and the 10.5 months of supply in October is far above normal.  This graph shows existing home sales Not Seasonally Adjusted (NSA).
The red columns are for 2010. Sales for the last four months are significantly below the previous years, and sales will probably be weak for the remainder of 2010.
Existing home sales were weak in October, and will continue to be weak for some time. Inventory is very high - and the significant year-over-year increase in inventory is very concerning. The high level of inventory and months-of-supply will put downward pressure on house prices.
• Moody's: Commercial Real Estate Prices increase in September
Moody's reported that the Moody’s/REAL All Property Type Aggregate Index increased 4.3% in September. This reverses the sharp decline in August. Note: Moody's CRE price index is a repeat sales index like Case-Shiller - but there are far fewer commercial sales - and that can impact prices and make the index very volatile.  This graph is a comparison of the Moodys/REAL Commercial Property Price Index (CPPI) and the Case-Shiller composite 20 index.
CRE prices only go back to December 2000.
The Case-Shiller Composite 20 residential index is in blue (with Dec 2000 set to 1.0 to line up the indexes).
It is important to remember that the number of transactions is very low and there are a large percentage of distressed sales.
• CoreLogic: Total unsold housing inventory increases to 6.3 million units  From CoreLogic: Shadow Inventory Jumps More Than 10 Percent in One Year, Pushing Total Unsold Inventory to 6.3 Million Units
This graph from CoreLogic shows the breakdown of "shadow inventory" by category. For this report, CoreLogic estimates the number of 90+ day delinquencies, foreclosures and REOs not currently listed for sale. Obviously if a house is listed for sale, it is already included in the "visible supply" and cannot be counted as shadow inventory.
CoreLogic estimates the "shadown inventory" (by this method) at about 2.1 million units.
• Other Economic Stories ...
• Housing Supply: What do all the numbers mean?
• Galleries and more ...
• From the Chicago Fed: Index shows economic activity picked up in October
• From the BEA: Q3 real GDP growth revised up to 2.5% annualized rate
• From the BEA October report: Personal income increased $57.6 billion, or 0.5 percent ... Personal consumption expenditures (PCE) increased $44.0 billion, or 0.4 percent.
• From the Fed FOMC Minutes: Forecasts revised down again, Disagreement on outlook.
• From LPS Applied Analytics Over 4.3 million loans 90+ days or in foreclosure
• From the American Trucking Association: ATA Truck Tonnage Index Rose 0.8 Percent in October
• Unofficial Problem Bank list increases to 919 Institutions
Best wishes to all!
Calculated Risk: 11/28/10
Sunday, November 28, 2010
The recent improvement in economic news
by CalculatedRisk on 11/28/2010 07:27:00 PM
Earlier:
• Schedule for Week of Nov 28th
• A Summary for Week ending November 27th
It is worth noting the recent improvement in economic news:
• The October employment report showed a gain of 151,000 nonfarm payroll jobs, the most since April ex-Census. Expectations are for a similar gain in November, although probably not enough jobs added to push down the unemployment rate.
• The BEA estimated real GDP grew at a 2.5% annual rate in Q3. This is still sluggish, but an improvement from the 1.7% growth rate in Q2.
• The Personal Income and Outlays report for October indicated incomes grew at a 0.5% rate (month-to-month), and it appears PCE has grown at about a 3% annualized rate over the last three months. The personal saving rate was 5.7% in October, and although I expect the rate to increase a little more - it appears a majority of the adjustment is behind us (a rising saving rate is a drag on personal consumption).
• The 4-week average of initial weekly unemployment claims has declined to 436,000 last week from over 480,000 at the end of August. The weekly reading was 407,000 last week; the lowest since July 2008.
• Most regional manufacturing surveys, with the exception of the NY Fed survey (empire state), has shown a pickup in manufacturing. This suggests the manufacturing sector is still improving (the ISM manufacturing index for November will be released on Wednesday).
• Trucking and rail traffic improved in October, although the Ceridian diesel fuel index was weak.
• The Architecture Billings Index (a leading indicator for commercial real estate) is near flat - suggesting investment in commercial structures such as hotels, offices and malls will stop contracting next year. (addition by subtraction!)
• Even small business optimism has improved slightly.
Most of the reasons for the recent slowdown are still with us - less stimulus spending, the end of the inventory adjustment, problems in Europe and a slowdown in China, and cutbacks at the state and local level - but it appears Residential investment (RI) has bottomed and will most likely add to GDP growth in 2011. I believe the RI drag is now behind us, and RI is usually the best leading indicator for the economy.
The data is still mixed and fits with my general view of a sluggish and choppy recovery (my view since the spring of 2009). Although I don't see a sharp increase in growth, I think the pace of recovery will probably pick up a little bit in 2011, and I'll take the over on the consensus view of 2.5% GDP growth in 2011. My guess is 3%+ GDP growth in 2011 - still not a strong recovery given the amount of slack in the economy, but an improvement over 2010.
Unfortunately there probably will not be enough growth to significantly reduce the unemployment rate in 2011.
Note: I'll add more before the end of the year, but I've been sharing my thoughts with a few analysts and economic commentators and I try to post my views whenever they change - even a little. Right now it looks like the "slowdown, but no double dip call" was correct (it is still early), and now I'm becoming a little more optimistic and taking the "over" on 2011 GDP growth (still no v-shape recovery though).
Sunday, July 18, 2010
July 17, 2010, 12:00 pm
I Would Do Anything For Stimulus, But I Won’t Do That (Wonkish)
It’s really not relevant to current policy debates, but there’s an issue that’s been nagging at me, so I thought I’d write it up.
Right now, the real policy debate is whether we need fiscal austerity even with the economy deeply depressed. Obviously, I’m very much opposed — my view is that running deficits now is entirely appropriate.
But here’s the thing: there’s a school of thought which says that deficits are never a problem, as long as a country can issue its own currency. The most prominent advocate of this view is probably Jamie Galbraith, but he’s not alone.
Now, Jamie and I are, I think, in complete agreement about what we should be doing now. So we’re talking theory, not practice. But I can’t go along with his view that
So long as U.S. banks are required to accept U.S. government checks — which is to say so long as the Republic exists — then the government can and does spend without borrowing, if it chooses to do so … Insolvency, bankruptcy, or even higher real interest rates are not among the actual risks to this system.
OK, I don’t think that’s right. To spend, the government must persuade the private sector to release real resources. It can do this by collecting taxes, borrowing, or collecting seignorage by printing money. And there are limits to all three. Even a country with its own fiat currency can go bankrupt, if it tries hard enough.
How does that work? A bit of modeling under the fold.
Let’s think in terms of a two-period model, although I won’t need to say much about the first period. In period 1, the government borrows, issuing indexed bonds (I could make them nominal, but then I’d need to introduce expectations about inflation, and we’ll end up in the same place.) This means that in period 2 the government owes real debt service in the amount D.
The government may meet this debt service requirement, in whole or in part, by running a primary surplus, an excess of revenue over current spending. Let’s suppose, however, that there’s an upper limit S to the feasible primary surplus — a limit imposed by political constraints, administrative issues (if taxes are too high everyone will evade), or the sheer fact that tax collections can’t exceed GDP.
But the government also has a printing press. The real revenue it collects by using this press is [M(t) - M(t-1)]/P(t), where M is the money supply and P the price level.
What determines the price level? Let’s assume a simple quantity theory, with the price level proportional to the money supply:
P(t) = V*M(t)
By assuming this, I’m actually making the most favorable assumption about the power of seignorage, since in practice, running the printing presses leads to a fall in the real demand for money (people start using lumps of coal or whatever as substitutes.)
OK, now let’s ask what happens if the government has run up enough debt that the upper limit on the primary surplus is a binding constraint, and it’s necessary to run the printing presses to make up the difference. In that case,
[M(t) - M(t-1)]/P(t) = D – S
But P is proportional to M, so this becomes
[M(t) - M(t-1)]/VM(t) = D – S
Rearrange a bit, and we have
M(t)/M(t-1) = 1/[1 - V[D-S]]
And what does this imply? Since the price level is, by assumption, proportional to M, this tells us that the higher the debt burden, the higher the required rate of inflation — and, crucially, that as D-S heads toward a critical level, this implied inflation heads off to infinity. That is, it looks like this:

So there is a maximum level of debt you can handle. In practice, if it makes sense to say such a thing with regard to a stylized model, at some point lower than the critical level implied by this model the government would decide that default was a better option than hyperinflation.
And going back to period 1, lenders would take this possibility into account. So there are real limits to deficits, even in countries that can print their own currency.
Now, I’m sure I’m about to get comments and/or responses on other blogs along the lines of “Ha! So now Krugman admits that deficits cause hyperinflation! Peter Schiff roolz” Um, no — in extreme conditions they CAN cause hyperinflation; we’re nowhere near those conditions now. All I’m saying here is that I’m not prepared to go as far as Jamie Galbraith. Deficits can cause a crisis; but that’s no reason to skimp on spending right now.
Listen to this episode
Today, forecast, inflation, and the failure of monetary policy featuring Chris Whalen and Nouriel Roubini
LEADING OFF WITH A SUMMARY OF THE DEMAND SIDE FORECAST:
A summary of the demand side forecast is and has been that we are in recession and are now bouncing along the bottom. Because of inadequate policy response, in particular failure to help states and localities with open-ended support, the bottom is sloped downward. The only resolution to the current depression will come from a reorientation of the economy from a consumer base to one based on the development and maintenance of public goods. Absent this public investment, there is no recovery.
Significant new dangers have appeared in the form of public policy favoring austerity. Some have said we are threatened with a repeat of 1937. Our view is we are still in 1932, having failed to correct the causes of the financial collapse or mitigate the impact of crushing debt on the household sector. We have not had our New Deal of 1933. The recent financial regulation notwithstanding. That means the opportunity for a repeat of the crisis. The only life in the economy over the past year has been the ARRA stimulus. It is waning.
A quick summary of the week from Calculated Risk
There are many who see continued recovery in these numbers. Some who see the threat of a double dip. In fact, we've put up double dip week on the blog, with Krugman, Galbraith, Stiglitz and others -- David Levy, Stephanie Kelton, Calculated Risk, Steven Roach, so far.
Perhaps most instructive are the consumer confidence numbers. Coming down now at the University of Michigan. The survey's preliminary July reading on the overall index on consumer sentiment plummeted to 66.5 from 76.0 in June. The figure was below the median forecast of 74.5 among economists polled by Reuters.
 Click on graph for larger image in new window.
Calculated risk calls consumer confidence a coincident indicator. Demand Side sees it as also a leading indicator.
We are holding on to our continued recession, continued depression, call.
FORECAST: INFLATION
Some economists we respect have taken the view that low interest rates for sovereign debt, particularly in the developed economies, is a sign of the market's confidence in those economies and a reason not to rein in government deficits. this is only partly correct, in our view. While we agree with the conclusion, low rates on Treasuries are the result of relative strength, not absolute strength.
We also, along with Minsky and, we believe, Keynes, differentiate between asset prices and consumer prices. Asset prices have been in full-scale deflation since the crisis, as exemplified by housing and commercial real estate. China's overbuilding of manufacturing capacity as stimulus has further depressed productive asset prices to levels below their cost. Result. Nothing is being built in the private sector.
Consumer prices are low and falling. Here, from the BLS report on the Consumer Price Index:
That is, with one-sixth to one-quarter of the economy idle, we are still producing all the consumer goods we can buy.
It is part of the Demand Side forecast that if idle productive capacity were put to work in public investment, both the inflation rate and growth would pick up immediately. If it is put to work in producing consumer goods, and subsidized by the government, as with the proposed programs to help small business or private employment, it will only depress prices further. Theoretically, if it were put to use in producing private investment goods, inflation and growth would resume, as with public investment. But there is no reason to do what China has done. The market for these goods is ample evidence that they are not needed.
On inflation, Paul Krugman takes the OECD to task for its incompetence in forecasting.
SEE KRUGMAN
http://krugman.blogs.nytimes.com/2010/07/17/conventional-madness-revisited/
Conventional Madness, Revisited
In late May I had a, um, negative reaction to the latest OECD Economic Outlook. Not only did the report call for immediate fiscal austerity; it called for a sharp rise in US interest rates over the next year and a half, even though its own forecasts projected very high unemployment and below-target inflation at the end of 2011. The only justification given for this monetary tightening was the fact that “some long-term measures of inflation expectations have increased.” This was a reference to the TIPS spread, the difference between the interest rate on ordinary government bonds and bonds indexed to inflation.
So how’s the TIPS spread doing? The chart provided by Krugman and reproduced in today's transcript shows a cliff dive.
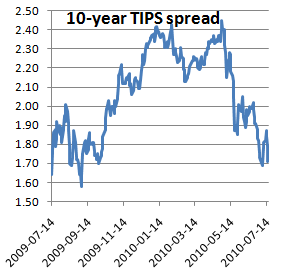 Treasury DepartmentTreasury Department
So yes, the spread widened for a while; then it plunged.
I eagerly await the OECD’s retraction of its previous policy advice, he concludes.
MONETARY POLICY
Monetary Policy has not worked. Here we differ from Paul Krugman, who is worried by the so-called zero bound. More later.
But monetary policy, zero interest rates and aggressive purchases of financial assets by the Fed, has not worked. This is an empirical fact -- there is no credit growth, there is no investment -- and it is not going to work. This is no longer such a fringist, outsider view, as we'll hear in a moment with Chris Whalen, perhaps the preeminent banking analyst. Odd, to be fringist, that is, because the vast majority of analysts and forecasters rely on extrapolating the trend, jumping up and down on their spreadsheets to look over the horizon, we've said. The trend for monetary policy efficacy is not up.
And more odd because the failure of monetary policy follows directly from the neoclassical vew of the economy. Self-interested economic actors are now hoarding cash. Self interest is supposed to activate the invisible hand for the benefit of all. Doesn't work too good in debt deflation.
What does monetary policy do?
Back up. What is monetary pollicy supposed to do? It is supposed to make capital cheaper and encourage investment.
But what does it actually do?
It introduces easy leverage for big players. Cheap interest rates that are not available to everybody. It inflates or attempts to inflate the value of assets, but succeeds predominantly -- nearly exclusively -- in doing this only for financial assets. Thus it divorces the financial from the real.
Here is Chris Whalen, the voice of Institutional Risk Analytics, the preeminant banking analyist. Recognize that all our auido on Demand Side is heavily edited. And the other voice you hear is Nouriel Roubini.
WHALEN
Chris Whalen, who has been right about banks for so long, it's a wonder people contradict him. Whalen is saying the Fed's zero interest policy has not worked. Again, that conclusion is nakedly apparent , insofar as no investment has been produced. Banks and corporations are hoarding cash, while the rest of us are paying down our debt.
A chart of Fed rates that accompanied Whalen's comments is available in the transcript.

Demand Side is a great fan of Steve Keen, the Australian economist and disciple of Hyman Minsky, whose computer simulations have replicated real world instabilities, such as we have experienced over the past three years. Keen produce one run which tested the economic impact of giving money to banks versus to the debtors. It was no surprise to us when the results demonstrated a far more constructive result when debtors got the money than when lenders were bailed out. Debtors released it into the real economy. Banks are hoarding it.
Paul Krugman is concerned about the zero bound. The rest of the world views Krugman as a flaming liberal, and perhaps he is. But we are situated to his left. His complaint is about the zero bound. Monetary policy is stuck because you can't lend at below zero. In Demand Side's view, this is like saying if only we had a bigger feather, we could hammer that nail. It is not that the tool isn't big enough, it's just not up to the task.
Connecting the financial economy to the real economy has to be done on the demand side. Create the demand. That will create the investment opportunities. We go further, in saying the investment opportunities are in infrastructure, education, climate change action, energy and other public goods. These are investment, not spending, because there are real benefits produced that can be captured for debt service.
Otherwise the consturctive policy moves are writing down debts to real values that can be serviced by the debtors. No amount of supply side largesse will cure corporate banks of greed. If a CEO WERE to step out in support of the real economy, he would be fired.
The bottom line. The Fed's monetary policy is not going to work any better in the future than it has in the past. The longer these guys have the power, the longer we will be in the soup.
Today, forecast, inflation, and the failure of monetary policy featuring Chris Whalen and Nouriel Roubini
LEADING OFF WITH A SUMMARY OF THE DEMAND SIDE FORECAST:
A summary of the demand side forecast is and has been that we are in recession and are now bouncing along the bottom. Because of inadequate policy response, in particular failure to help states and localities with open-ended support, the bottom is sloped downward. The only resolution to the current depression will come from a reorientation of the economy from a consumer base to one based on the development and maintenance of public goods. Absent this public investment, there is no recovery.
Significant new dangers have appeared in the form of public policy favoring austerity. Some have said we are threatened with a repeat of 1937. Our view is we are still in 1932, having failed to correct the causes of the financial collapse or mitigate the impact of crushing debt on the household sector. We have not had our New Deal of 1933. The recent financial regulation notwithstanding. That means the opportunity for a repeat of the crisis. The only life in the economy over the past year has been the ARRA stimulus. It is waning.
A quick summary of the week from Calculated Risk
- NFIB Survey showed small businesses were more pessimistic in June
- Ceridian Diesel Fuel index showed a sharp decline in June
- The Census Bureau reported the trade deficit increased in May.
- The BLS reported low labor turnover in May.
- The Association of American Railroads reported softer rail traffic in June.
- The MBA reported the mortgage purchase index was at the lowest level since December 1996.
- The Census Bureau reported retail sales fell 0.5% in June.
- The minutes of the FOMC meeting showed the Fed revised down their forecast for GDP growth, and revised up their forecast for unemployment.
- The Empire State Manufacturing Survey showed the pace of growth "slowed substantially" in July.
- The Fed reported that Industrial production and Capacity Utilization were mostly flat in June.
- The Philly Fed index showed slowing growth in July.
- The Consumer Price Index declined 0.1% in June.
- The Reuters / University of Michigan's Consumer Sentiment index declined sharply in July.
There are many who see continued recovery in these numbers. Some who see the threat of a double dip. In fact, we've put up double dip week on the blog, with Krugman, Galbraith, Stiglitz and others -- David Levy, Stephanie Kelton, Calculated Risk, Steven Roach, so far.
Perhaps most instructive are the consumer confidence numbers. Coming down now at the University of Michigan. The survey's preliminary July reading on the overall index on consumer sentiment plummeted to 66.5 from 76.0 in June. The figure was below the median forecast of 74.5 among economists polled by Reuters.
Click on graph for larger image in new window. Calculated risk calls consumer confidence a coincident indicator. Demand Side sees it as also a leading indicator.
We are holding on to our continued recession, continued depression, call.
FORECAST: INFLATION
Some economists we respect have taken the view that low interest rates for sovereign debt, particularly in the developed economies, is a sign of the market's confidence in those economies and a reason not to rein in government deficits. this is only partly correct, in our view. While we agree with the conclusion, low rates on Treasuries are the result of relative strength, not absolute strength.
We also, along with Minsky and, we believe, Keynes, differentiate between asset prices and consumer prices. Asset prices have been in full-scale deflation since the crisis, as exemplified by housing and commercial real estate. China's overbuilding of manufacturing capacity as stimulus has further depressed productive asset prices to levels below their cost. Result. Nothing is being built in the private sector.
Consumer prices are low and falling. Here, from the BLS report on the Consumer Price Index:
The CPI for All Urban Consumers declined 0.1 percent in June on a seasonally adjusted basis, the U.S. Bureau of Labor Statistics reported today. Over the last 12 months, the index increased 1.1 percent before seasonal adjustment. The index for all items less food and energy rose slightly in June after increasing slightly in May. ... The 12-month change in the index for all items less food and energy remained at 0.9 percent for the third month in a row. The index for owners' equivalent rent also rose very slightly, its first increase since August 2009. Even with the slight monthly increase, Owners' equivalent rent is down year-over-year.
The general disinflationary trend continues - CPI is unchanged over the last 8 months - and with all the slack in the system (especially the 9.5% unemployment rate), CPI will probably stay low or even fall further.
That is, with one-sixth to one-quarter of the economy idle, we are still producing all the consumer goods we can buy.
It is part of the Demand Side forecast that if idle productive capacity were put to work in public investment, both the inflation rate and growth would pick up immediately. If it is put to work in producing consumer goods, and subsidized by the government, as with the proposed programs to help small business or private employment, it will only depress prices further. Theoretically, if it were put to use in producing private investment goods, inflation and growth would resume, as with public investment. But there is no reason to do what China has done. The market for these goods is ample evidence that they are not needed.
On inflation, Paul Krugman takes the OECD to task for its incompetence in forecasting.
SEE KRUGMAN
http://krugman.blogs.nytimes.com/2010/07/17/conventional-madness-revisited/
Conventional Madness, Revisited
In late May I had a, um, negative reaction to the latest OECD Economic Outlook. Not only did the report call for immediate fiscal austerity; it called for a sharp rise in US interest rates over the next year and a half, even though its own forecasts projected very high unemployment and below-target inflation at the end of 2011. The only justification given for this monetary tightening was the fact that “some long-term measures of inflation expectations have increased.” This was a reference to the TIPS spread, the difference between the interest rate on ordinary government bonds and bonds indexed to inflation.
So how’s the TIPS spread doing? The chart provided by Krugman and reproduced in today's transcript shows a cliff dive.
Treasury DepartmentTreasury DepartmentSo yes, the spread widened for a while; then it plunged.
I eagerly await the OECD’s retraction of its previous policy advice, he concludes.
MONETARY POLICY
Monetary Policy has not worked. Here we differ from Paul Krugman, who is worried by the so-called zero bound. More later.
But monetary policy, zero interest rates and aggressive purchases of financial assets by the Fed, has not worked. This is an empirical fact -- there is no credit growth, there is no investment -- and it is not going to work. This is no longer such a fringist, outsider view, as we'll hear in a moment with Chris Whalen, perhaps the preeminent banking analyst. Odd, to be fringist, that is, because the vast majority of analysts and forecasters rely on extrapolating the trend, jumping up and down on their spreadsheets to look over the horizon, we've said. The trend for monetary policy efficacy is not up.
And more odd because the failure of monetary policy follows directly from the neoclassical vew of the economy. Self-interested economic actors are now hoarding cash. Self interest is supposed to activate the invisible hand for the benefit of all. Doesn't work too good in debt deflation.
What does monetary policy do?
Back up. What is monetary pollicy supposed to do? It is supposed to make capital cheaper and encourage investment.
But what does it actually do?
It introduces easy leverage for big players. Cheap interest rates that are not available to everybody. It inflates or attempts to inflate the value of assets, but succeeds predominantly -- nearly exclusively -- in doing this only for financial assets. Thus it divorces the financial from the real.
Here is Chris Whalen, the voice of Institutional Risk Analytics, the preeminant banking analyist. Recognize that all our auido on Demand Side is heavily edited. And the other voice you hear is Nouriel Roubini.
WHALEN
Chris Whalen, who has been right about banks for so long, it's a wonder people contradict him. Whalen is saying the Fed's zero interest policy has not worked. Again, that conclusion is nakedly apparent , insofar as no investment has been produced. Banks and corporations are hoarding cash, while the rest of us are paying down our debt.
A chart of Fed rates that accompanied Whalen's comments is available in the transcript.

Demand Side is a great fan of Steve Keen, the Australian economist and disciple of Hyman Minsky, whose computer simulations have replicated real world instabilities, such as we have experienced over the past three years. Keen produce one run which tested the economic impact of giving money to banks versus to the debtors. It was no surprise to us when the results demonstrated a far more constructive result when debtors got the money than when lenders were bailed out. Debtors released it into the real economy. Banks are hoarding it.
Paul Krugman is concerned about the zero bound. The rest of the world views Krugman as a flaming liberal, and perhaps he is. But we are situated to his left. His complaint is about the zero bound. Monetary policy is stuck because you can't lend at below zero. In Demand Side's view, this is like saying if only we had a bigger feather, we could hammer that nail. It is not that the tool isn't big enough, it's just not up to the task.
Connecting the financial economy to the real economy has to be done on the demand side. Create the demand. That will create the investment opportunities. We go further, in saying the investment opportunities are in infrastructure, education, climate change action, energy and other public goods. These are investment, not spending, because there are real benefits produced that can be captured for debt service.
Otherwise the consturctive policy moves are writing down debts to real values that can be serviced by the debtors. No amount of supply side largesse will cure corporate banks of greed. If a CEO WERE to step out in support of the real economy, he would be fired.
The bottom line. The Fed's monetary policy is not going to work any better in the future than it has in the past. The longer these guys have the power, the longer we will be in the soup.
The survey's preliminary July reading on the overall index on consumer sentiment plummeted to 66.5 from 76.0 in June.
The figure was below the median forecast of 74.5 among economists polled by Reuters.
Click on graph for larger image in new window. Consumer sentiment is a coincident indicator - and this is further evidence of an economic slowdown.
Interesting - the survey's one-year inflation expectations increased to 2.9% even as measured inflation has been falling.

Saturday, July 17, 2010
Double Dip Discussion
by CalculatedRisk on 7/17/2010 07:47:00 PM
The frequency of "double dip" searches keeps increasing, see Google Trends ...
Paul Krugman writes: De Facto Double Dips
Let’s be clear: a recovery that involves growth so slow that unemployment and excess capacity rise, not fall, isn’t really a recovery. If we have only have 1 1/2 percent growth, that will amount to a double dip in all the senses that matter.I've been focused on a technical double dip (see Recession Dating and a "Double Dip"), but I agree with Krugman that a further slowdown - following the below trend first half of 2010 - will definitely feel like a recession - and it will probably lead to an unemployment rate "double dip".
And from Nouriel Roubini: Double-Dip Days
The global economy, artificially boosted since the recession of 2008-2009 by massive monetary and fiscal stimulus and financial bailouts, is headed towards a sharp slowdown this year as the effect of these measures wanes.The 2nd half slowdown is here. I still think we will avoid a technical double-dip recession, but it will probably feel like one.
...
At best, we face a protracted period of anemic, below-trend growth in advanced economies as deleveraging by households, financial institutions, and governments starts to feed through to consumption and investment.
...
The global slowdown – already evident in second-quarter data for 2010 – will accelerate in the second half of the year. ... The likely scenario for advanced economies is a mediocre U-shaped recovery, even if we avoid a W-shaped double dip. In the US, annual growth was already below trend in the first half of 2010 (2.7% in the first quarter and estimated at a mediocre 2.2% in April-June). Growth is set to slow further, to 1.5% in the second half of this year and into 2011.
...
Fasten your seat belts for a very bumpy ride.
Some day growth will pickup again. The debt problems will be with us for some time, but one of the keys for more growth is absorption of excess capacity. New investment is already happening for semiconductor manufacturing (see AMAT and other semi-equipment manufactures, and the WSJ Applied Materials Boosts Revenue Forecast)
But there is too much capacity in most of the economy. We see this in housing (the good news is there will be a record low number of new housing units delivered this year), and in overall industrial capacity utilization. As an example, domestic auto production is still about 25% below the level of 2006 - so there is no need to expand production. There is also excess capacity in office space, retail space, and other categories of commercial real estate.
The U.S. population is still growing, new households are being formed, and eventually this excess capacity will be absorbed. Until then the recovery will be sluggish and choppy (at best) ... and there are still the debt issues.
As Nouriel wrote: "Fasten your seat belts for a very bumpy ride."
Conventional Madness, Revisited
In late May I had a, um, negative reaction to the latest OECD Economic Outlook. Not only did the report call for immediate fiscal austerity; it called for a sharp rise in US interest rates over the next year and a half, even though its own forecasts projected very high unemployment and below-target inflation at the end of 2011. The only justification given for this monetary tightening was the fact that “some long-term measures of inflation expectations have increased.” This was a reference to the TIPS spread, the difference between the interest rate on ordinary government bonds and bonds indexed to inflation.
So how’s the TIPS spread doing?
Treasury Department
So yes, the spread widened for a while; then it plunged.
I eagerly await the OECD’s retraction of its previous policy advice.
Wednesday, May 19, 2010
Fed Pianalto says nothing
Tuesday, May 18, 2010
Fed's Pianalto: "Subdued" Recovery, Unemployment Rate to decline "Gradually"
by CalculatedRisk on 5/18/2010 12:45:00 PM
From Cleveland Fed President Sandra Pianalto: Forecasting in Uncertain Times
As we are all aware, we're emerging from the deepest and longest recession since the Great Depression. Our models would tell us that the deeper the downturn in the economy, the more rapid the recovery. You've probably heard this referred to as a V-shaped recovery.We already know that a "V-shaped" recovery is off the table. Researchers at the San Francisco Fed argued yesterday for a recovery between a "U" and a "V", see The Shape of Things to Come, however those researchers focused on GDP, and I'd suggest GDI, employment and real personal income less transfer payments all suggest an even more sluggish recovery than GDP.
However, my outlook is that our journey out of this deep recession will be a slow one because we face two primary headwinds that I expect will temper growth for awhile. The first is the effect of prolonged unemployment, and the second is a heightened sense of caution on the part of consumers and businesspeople.
...
About half of those who are currently unemployed have been out of work for at least six months, and the longer someone is out of work, the harder it is to find a job. In the 1982 recession, which was another severe recession, the average duration of unemployment peaked at 21 weeks, but today the average is already over 30 weeks—a record high. Research also tells us that workers lose valuable skills during long spells of unemployment, and that some jobs simply don't return.
...
The second powerful headwind in this recession is a heightened sense of caution, driven by a deep uncertainty about where the "new normal" or baseline might be. A whole generation of Americans who began their working careers in the mid-1980s had experienced only long periods of prosperity punctuated by just two very brief downturns. Those experiences encouraged an expectation for relatively smooth growth. Now everyone's expectations have shifted as a result of this long and deep recession.
People's attitudes about their own prospects have fundamentally changed. In a recent survey by Ohio's Xavier University, 60 percent of those polled believe attaining the American dream is harder for this generation than ones before. And nearly 70 percent think it will be even more difficult for their children. Many people are now just aiming for “financial security” as their American dream
...
Businesses are also cautious. Business leaders base many decisions on forecasts, and they tell me that they are attaching the same high degree of uncertainty around their projections as I am. Most business leaders say that they’re not planning significant hiring until there’s more clarity about how the recovery is going to progress and about policies relating to health care, energy, the environment, and taxes. This caution translates into fewer job opportunities, fewer equipment purchases, fewer building projects—and on and on.
These two factors—overall caution and the effects of labor market damage—lead me to an outlook for relatively subdued output growth through this year and next, with unemployment rates that decline only gradually.
Also I'd add residential investment to Pianalto's two "headwinds". Usually housing is a key engine of growth in a recovery - for both GDP and employment - and this time any contribution from housing will be muted for some time.
Robert Kuttner schools Obama team on economics, politics

Hire deficits: Until people start working, the economy won’t
Robert Kuttner
Boston Globe
May 11, 2010
THE GOOD NEWS is that the private sector created 231,000 jobs in April. The bad news is that unemployment rose from 9.7 to 9.9 percent because more people are seeking work — over 800,000 entered the labor force in April, dwarfing the increase in jobs. The true unemployment rate is over 17 percent if you count part-time workers who want full-time jobs plus those who have given up because the job search has become pointless, with more than five applicants for every job opening.
The economy needs a half million new jobs every month for the next four years, just to return to the prerecession unemployment rate of 2006. And that economy was nothing to brag about, with average wage growth lagging behind inflation since 2001.
Perversely, austerity has become the cure du jour. Top administration officials say there will be no new jobs initiative, because deficit reduction is needed to reassure the bond market. President Obama’s new fiscal commission is expected to recommend cutting services and raising taxes.
You have to wonder if the Obama economic team is talking to the political team. If the Democrats suffer a blowout in the November midterm elections and Obama risks being a one-term president, the biggest reason will be persistently high unemployment.
The issue of jobs has simply dropped off the radar screen. Obama tackled health care, and now he is focused on banking reform, immigration, and nuclear proliferation, which are all necessary causes — but he will live or die politically based on whether he can get more jobs and more good jobs created, with some measurable gains by November.
We seem to have settled into a pattern reminiscent of the late 1930s. Economic growth has turned positive — it was a respectable 3.2 percent in the first three months of 2010 — but today’s growth generates too few jobs. Why is that?
The aftermath of the financial blowout has left employers hesitant about hiring permanent workers. Consumers are buying again, but with high unemployment, flat wages, depressed pensions, and depleted home equity, they aren’t buying enough. Managers are working existing employees harder rather than hiring new ones.
For two decades, employers increasingly used outsourcing and off-shoring to cut their labor costs. That trend accelerated after the financial collapse. Many economists wonder whether permanent payroll jobs will ever return to their former level if present trends continue.
Overseas, Greece has agreed to a stringent budget-cutting program as the price of getting emergency aid from the European Union and the International Monetary Fund. Many British commentators have described their next government as a “poisoned chalice,’’ because the new prime minister will pursue hugely unpopular belt-tightening. At home, states are cutting jobs and services.
But the austerity cure slows growth, raises joblessness, and makes debt-reduction more painful. It’s better to restore high rates of growth and employment. Then, after recovery comes, we can balance the budget at a higher level of economic output.
In the late 1930s, Franklin Delano Roosevelt tackled joblessness with his public works programs. These were palliative, but the permanent cure was a massive economic recovery — as byproduct of World War II. When the war came, we damned the torpedoes and the deficit worries, and spent whatever it took to defeat the Nazis and the imperial Japanese.
Debt increased massively, but economic growth shot up to 12 percent a year for the four war years, and unemployment disappeared. The war also brought huge investments in manufacturing technology. That twin stimulus powered a 25-year postwar boom, and the war debt was easily paid down.
The war was also a big boost for labor, and not just because of the plentiful jobs. Roosevelt’s War Labor Board insisted that any company bidding for a defense contract treat its workers decently and not bust unions.
Obama’s challenge today is to define the economic equivalent of World War II — without the war — and inspire citizens to support it. Lately, the news has been dominated by the Boston water main break, the oil spill in the Gulf of Mexico, and layoffs of teachers. There is no shortage of candidates for public investment in infrastructure, renewable energy, advanced industry, and decent public services.
Instead of joining the austerity parade, Obama should be committing his administration to higher growth, public renewal, and good jobs.
Subscribe to:
Posts (Atom)

 Posts
Posts


