"Predictions and explanations are symmetrical and reversible."

- Karl Popper via George Soros

Wednesday, February 8, 2012

Upside forecast

Contrarian Analysis for 2012. Part 1.

Posted on 30 January 2012 by admin

Could 2012 Surprise to the Upside?

by Guest Author John Slater, Capital Matters

In January we are trained to predict the likely course of the coming year and more often than not we get it wrong. This year virtually everyone has had the same prediction: “We’ll muddle along at around 2.5% growth unless something really bad happens and then all bets are off.” The outliers tend to focus on the possibility that we are heading for a recession based in part on the negative call from the Economic Cycle Research Institute (ECRI). Yet some of the economic data is not cooperating with the doomsayers and our observations in the real world are that business for many of our clients is not all that bad and is in fact improving.

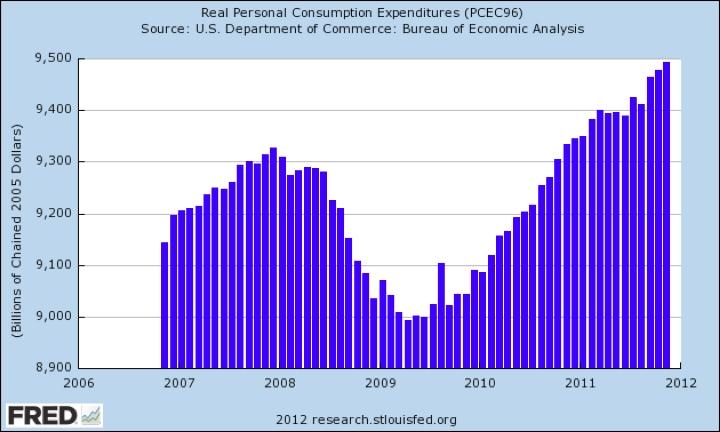
What if the pessimists are wrong and 2012 turns out to be a far more positive year for the economy than many are predicting? While the jury is still out, the data continues to improve in terms of employment and consumer spending.

Credit to Hale Stewart who recently published this and a number of other charts supportive of a positive economic case on Seeking Alpha. What’s the chance he could turn out to be right? Ignoring for the moment all the could go wrongs, what’s the case for a far stronger 2012 than is currently being predicted?

1. Everyone wants things to get better. This is not trivial. After four years of depression, everyone longs for the good old days. 2012 is predicted to be the best year since 2007 for the travel industry. What happens if Americans who have been accumulating dry powder for the past four years suddenly loosen their purse strings?

2. The Fed is committed to a massive and continuing program of monetizing the massive deficits the federal government continues to run. As we wrote recently, this has created a huge overhang of reserves in the banking industry. Should the banks begin to use these reserves to support new credit creation the impact would be significant.

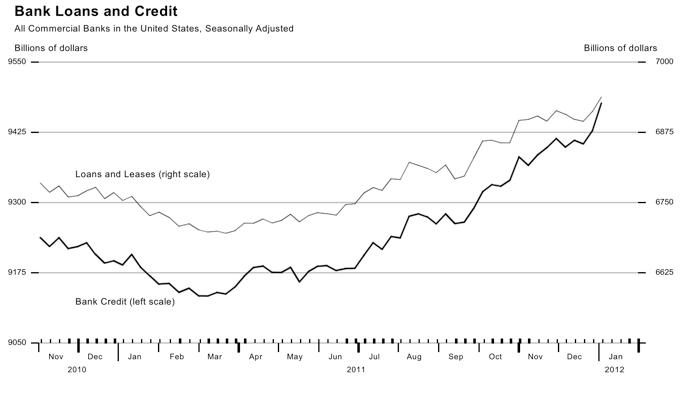
3. The banks may be doing exactly that. For the first time since the crash we can see positive movement in new bank credit creation.

Source: St. Louis Federal Reserve

In our investment banking practice we stay close to lender who can fund our client’s growth and provide the financing to make our M&A deals happen. For the first time in years, we are seeing evidence that some banks are getting serious about making commercial loans. Bank earnings were reported this week with varying results. While many banks are still suffering from the effects of the crash, a few, such as Wells Fargo, appear to be making real progress. It’s not hard to imagine that somewhere in America a bank CEO pulled his troops together this week to ask what could be done to put their institution on the positive side of that comparison. In response someone on his team may have actually suggested that banks used to make money by making loans. Multiplied across the economy, the impact could be significant.

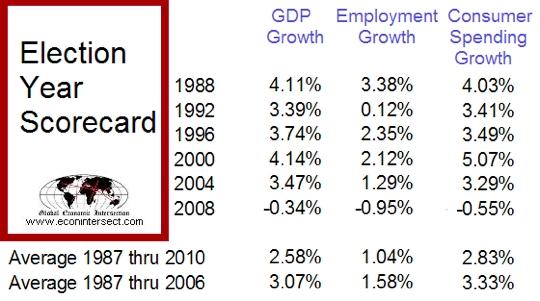
4. This is an election year. With the exception of 2008, recent election years have generally been very good for the economy.

Source: www.econointersect.com; Seeking Alpha

5. Outside of the western economies, the world continues to boom. Many believe that China is at risk of a hard landing, but the likelihood that 2012 is the year for such a negative outcome is quite low. China is in the midst of a historic transfer of leadership. The Chinese government will do everything possible to assure that this transfer does not happen during a period of economic crisis. They have many tools, including trillions of dollars of currency reserves, they can use to keep the music playing and have shown a past willingness to do so. Ongoing growth is certainly not limited to China; even Africa shows promise of real economic progress. The U. S. economy will continue to benefit from this ongoing explosion of global growth.

6. Finally and closer to home we are seeing signs of a pickup in merger and acquisition activity. Our industry has been in a deep depression since 2007. While there has been plenty of money on the sidelines in private equity and strategic coffers, weak private company earnings and the dearth of bank leverage have kept the lid on the deals market. Recently our new activity pipeline has shown signs of increasing strongly and we’ve heard reports from a number of law firms that their securities and transaction teams were quite business in Q4 2011 with strong activity sustained into 2012.

The deals business is an important barometer of economic activity. Deals generate fee incomes to banks, law firms, accounting firms and investment bankers with a significant multiplier effect in local economies. Equally important private company exits free up a significant amount of investment capital and former owners who have liquefied their business have a relatively strong predilection to support new ventures as angel investors and to invest a meaningful portion of their new liquidity in equities.

2012 will provide us with plenty of surprises. We’re just contrarian enough to suggest that one of those surprises may be a much stronger economy than the consensus expects.

About the Author

John Slater, a FOCUS Partner and Capital Financing Team Leader, has twenty eight years of M&A and capital raising experience. Prior to that time, he spent nine years as a practicing attorney, focused primarily on financial transactions, securities and tax matters. Mr. Slater has served clients in industries ranging from information technology and software based services, telecom, broadband distribution, digital media, and business services to manufacturing, health care and distribution logistics.  Complete bio is available here.

The New Conference Board LEI: First Look

The New Conference Board LEI: First Look

Posted on 30 January 2012 by admin

by Guest Author Dwaine van Vuuren, PowerStocks Investment Research, cross posted from Advisor Perspectives, dshort.com

The much anticipated Conference Board LEI revision is out. Many people were fearing that the removal of M2 from the composite would plunge it into recession territory, but that is not the case. Our own investigations into this matter in the lead up to the announcement revealed as such, but it is comforting to receive hard confirmation now.

Composite LEI’s such as the e-forecasting.com eLEI, the Conference Board US-LEI, the OECD US-LEI and the ECRI Weekly Leading Index (WLI) are generally composed of a small set (no more than 10) of well selected leading economic indicators that as a composite are subjected to rigorous statistical and out-of-sample testing. You can see a perfect example of the rigors of such statistical selection in the white paper produced by the Conference Board on the construction of their new LEI. For that reason we lean toward the use of these composites for recession forecasting purposes rather than large sets of seemingly unrelated economic leading indicators cobbled together. There is the well-known saying that if you torture large arbitrary data series enough, they will tell you any story you wish them to.

We do not wish to debate the revisions or which LEI is the best (more on that in future articles). Instead, we will have a “first look” at the suitability of the new LEI for recession dating. For differences between the new and old LEI, see Doug Short’s commentary here. Using a 6-months smoothed compound annualized growth rate of the monthly LEI (as defined by Geoffrey H. Moore) into Probit recession probability models, the new Conference Board LEI gives very accurate leading probabilities of recession with zero false positives since 1967 as shown below:

Click on graph for larger image.

The old LEI was more optimistic than the new one, but as you can see, the new LEI is still well below the trigger level for a recession call with probability of being in a recession now sitting at 0.7% and of being in recession within the next 6 months sitting at 6.2%. The one thing we notice is that once the probability of recession now rises above 13% this has ALWAYS led to recession within 2, 3, 10, 7, 0, 5 and 4 months respectively since 1967 with zero false alarms. This gives an average lead of 4.43 months, or 3.43 months to the real-time observer (since the LEI is one month post-dated).

If we prefer to observe the actual 6-month smoothed growth rates (annualised) themselves instead of the probabilities of recession derived therefrom, the chart below shows the average approach path of the LEI growth rate into NBER recession:

Click on graph for larger image.

We note that the growth rate needs to fall below zero to give us an average 6-months (5 month to real-time observer) warning of recession. The growth rate over the last 12 months is now highly correlated with an average recession approach path meaning we need to keep on our toes despite it being above zero. However, a small consolation is that the last 12 months is tracking quite a bit above the average peak approach path.

In similar fashion to that which we described above, neither the e-forecasting.com eLEI, the Conference Board LEI, nor the OECD US-LEI is forecasting recession in the next 3-4 months. The only other composite LEI flagging recession is the ECRI Weekly Leading Index (WLI), but as we stated in our previous posting (Further Improving on the use of the WLI) this is a weekly leading index and in the original spirit of the construction of said index, it is more timely and frequent but also subject to far less accuracy (more false positives).

This by no means says that recession within the next 6-12 months is out of the question. But it says we are neither in recession now nor should we be in one for the next 3 months at least. There is no doubt the US economy faces significant external risk. Coupled with a sub-par recovery, this means the smallest external shock can plunge us into recession. These external risks are not fully discounted into all the components of these composite LEI’s namely a possible steep and protracted Euro-area recession, an EU member sovereign default or credit event, hard landing in China, failure by congress to reach agreement on deficit reductions, further possible US credit rating downgrades, Iran tensions/conflicts and oil-price shocks. The probability models just look at what we are seeing in the US economic leading indicators and do not take into account these external factors (since in our view, this would be speculation and we just want to deal with hard real numbers). Should these external shocks come to light, they will certainly show up in the US economy somewhere (in “short-order”) and then be detected by models, but until then one cannot speculate on the probability of these external risks. We can only acknowledge they exist, and are many. Our favoured approach is to watch short leading probabilities (4-6 months) and action stock market positions accordingly as having to action long-leading predictions that can vary anywhere between 6 to 18 months with wide standard deviation is unlikely to produce productive results in the long run.

Related Articles

Conference Board: LEI to be Revised by Lance Roberts (GEI News, 19 Jan 2012)

All Posts on Leading Economic Indicator

All Posts on Economic Forecasts


About the Author

Dwaine van Vuuren is CEO of PowerStocks Investment Research, a South African-based provider of investment research. If you would like to receive the next 4 weeks SuperIndex Recession Reports for free, just email us at research@powerstocks.co.za with FREE SUPERINDEX in the subject line.

Recovery Measures still below peak: Calculated Risk

Recovery Measures still below peak

by CalculatedRisk

By request, here is an update to four key indicators used by the NBER for business cycle dating: GDP, Employment, Industrial production and real personal income less transfer payments.
Note: The following graphs are all constructed as a percent of the peak in each indicator. This shows when the indicator has bottomed - and when the indicator has returned to the level of the previous peak. If the indicator is at a new peak, the value is 100%.
These graphs show that several major indicators are still significantly below the pre-recession peaks.
GDP Percent Previous PeakClick on graph for larger image.
This graph is for real GDP through Q4 2011. Real GDP returned to the pre-recession in Q3 2011, and Gross Domestic Income (not shown) returned to the pre-recession peak in Q2 - GDI for Q4 will be released with the 2nd estimate of GDP. (For a discussion of GDI, see here).
At the worst point, real GDP was off 5.1% from the 2007 peak. Real GDI was off 5.7% at the trough.
Personal Income less TransferReal GDP has performed better than other indicators ...
This graph shows real personal income less transfer payments as a percent of the previous peak through December.
This measure was off 10.7% at the trough.
Real personal income less transfer payments is still 4.8% below the previous peak.
Industrial Production This graph is for industrial production through December.
Industrial production was off over 17% at the trough, and has been one of the stronger performing sectors during the recovery.
However industrial production is still 5.4% below the pre-recession peak, and it will probably be some time before industrial production returns to pre-recession levels.
Employment The final graph is for employment. This is similar to the graph I post every month comparing percent payroll jobs lost in several recessions.
Payroll employment is still 4.1% below the pre-recession peak.
If the economy adds 243 thousand payroll jobs per month on average (the January report), it will take another 2 years to get back to the pre-recession employment peak. And that doesn't count growth of the working age population over the last 4+ years.
Yesterday:
• Summary for Week ending February 3rd
• Schedule for Week of February 5th

Calculated Risk says Housing Bottom is Here


Housing Bottom is Here

by CalculatedRisk

There have been some recent articles arguing the “housing bottom is nowhere in sight”. That isn’t my view.
First there are two bottoms for housing. The first is for new home sales, housing starts and residential investment. The second bottom is for prices. Sometimes these bottoms can happen years apart.
For the economy and jobs, the bottom for housing starts and new home sales is more important than the bottom for prices. However individual homeowners and potential home buyers are naturally more interested in prices. So when we discuss a “bottom” for housing, we need to be clear on what we mean.
Total Housing Starts and Single Family Housing Starts Click on graph for larger image.
For new home sales and housing starts, it appears the bottom is in, and I expect an increase in both starts and sales in 2012.
As the first graph shows, housing starts, both total and single family, bottomed in 2009 and have mostly moved sideways since then - with some distortions due to the ill-conceived housing tax credit.
New Home SalesNew Home sales probably bottomed in mid-2010 and have flat lined since then.
Back in 2009, when I first wrote about the two bottoms, I thought we were close on housing starts and new home sales - but that it was "way too early to try to call the bottom in prices." In real terms, house prices have fallen another 10% to 15% since I wrote that post according to the CoreLogic and Case-Shiller house price indexes.
And it now appears we can look for the bottom in prices. My guess is that nominal house prices, using the national repeat sales indexes and not seasonally adjusted, will bottom in March 2012.
The problem with using the house price indexes to look for a bottom is that they are reported with a significant lag. As an example, the recently released Case-Shiller index was for November and the index is an average of September, October and November - so it is a report for several months ago. The CoreLogic index is a little more current - the recent release was for December, and CoreLogic uses a weighted average for prices (December weighted the most) - but that is still quite a lag.
Both of those indexes will bottom seasonally around March, and then start increasing again.
There are several reasons I think that house prices are close to a bottom. First prices are close to normal looking at the price-to-rent ratio and real prices (especially if prices fall another 4% to 5% NSA between the November Case-Shiller report and the March report). Second the large decline in listed inventory means less downward pressure on house prices, and third, I think that several policy initiatives will lessen the pressure from distressed sales (the probable mortgage settlement, the HARP refinance program, and more).
Of course these are national price indexes and there will be significant variability across the country. Areas with a large backlog of distressed properties - especially some states with a judicial foreclosure process - will probably see further price declines.
And this doesn't mean prices will increase significantly any time soon. Usually towards the end of a housing bust, nominal prices mostly move sideways for a few years, and real prices (adjusted for inflation) could even decline for another 2 or 3 years.
But most homeowners and home buyers focus on nominal prices and there is reasonable chance that the bottom is here.

Goldman Sachs participation rate forecast

http://feedproxy.google.com/~r/CalculatedRisk/~3/eZy68kdxc58/impact-of-changes-in-participation-rate.html

by CalculatedRisk
Yesterday Goldman Goldman Sachs economist Sven Jari Stehn argued that the labor force participation rate would remain "broadly flat at 63.7% through the end of 2013". He argued there would be a cyclical boost to the participation rate this year from the recovering economy, but a structural decline in the participation rate due to demographics. (Note: some decline in the participation rate has been expected over the next couple of decades).

The updated population controls from the 2010 Census showed a higher percentage of younger and older workers compared to the prime working age group (25 to 54), and also more women (participation rate is lower for women) than originally estimated - so the aggregate participation rate is now at 63.7%. Stehn argues that structural factors alone could push the aggregate participation rate down further to 63.1% by the end of 2012, but that this will probably be offset by more people returning to the labor force as the economy recovers.

The participation rate plays a key role in calculating to unemployment rate. First a few definitions from the BLS Glossary:

• Civilian noninstitutional population: Included are persons 16 years of age and older residing in the 50 States and the District of Columbia who are not inmates of institutions (for example, penal and mental facilities, homes for the aged), and who are not on active duty in the Armed Forces.

• Labor force: The labor force includes all persons classified as employed or unemployed in accordance with the definitions contained in this glossary.

• Labor force participation rate: The labor force as a percent of the civilian noninstitutional population.

• Unemployment rate: The unemployment rate represents the number unemployed as a percent of the labor force.

So a lower participation rate - with the same level of employment - would mean a lower unemployment rate.

Below is a table showing the sensitivity of the unemployment rate to three levels of the participation rate (centered around Goldman's forecast) and three rates of job creation for 2012. (note: this is mixing two different surveys - the household survey for the participation rate and unemployment rate, and the establishment survey for payroll jobs. Over time these two surveys move together, but there can be significant variability in the short run).
December 2012 Unemployment Rate based on Jobs added and Participation Rate
Participation Rate
63.4% 63.7% 64.0%
Jobs added per month (000s)
150 7.6% 8.0% 8.5%
200 7.2% 7.7% 8.1%
250 6.9% 7.3% 7.8%

If the January pace of payroll employment growth continues (around 250 thousand jobs per month), and the participation rate stays at 63.7%, then the unemployment rate could fall to 7.3% in December 2012. But even at a slower pace of payroll growth, the unemployment rate could be at or below 8% by the end of the year - unless the participation rate rises or the economy slows sharply.

The recent FOMC projections (see below) are for the unemployment rate to be in the 8.2% to 8.5% range by Q4 2012, and perhaps the FOMC was expecting the participation rate to increase this year.

If the participation rate doesn't increase, and payroll growth continues (even at 150 thousand per month), then the FOMC projections are too high. But even if the FOMC revises down their unemployment rate forecast, they will still view a 7.5% to 8% unemployment rate at the end of 2012 as unacceptably high.

Unemployment projections of Federal Reserve Governors and Reserve Bank presidents
Unemployment Rate1 2012 2013 2014
January 2012 Projections 8.2 to 8.5 7.4 to 8.1 6.7 to 7.6
1 Projections for the unemployment rate are for the average civilian unemployment rate in the fourth quarter of the year indicated.

Monday, November 14, 2011

SF Fed: Future Risks Up

Future Recession Risks: An Update

By Travis J. Berge, Early Elias, and Oscar Jorda

In 2010, statistical experiments based on components of the Conference Board’s Leading Economic Index showed a significant possibility of a U.S. recession over a 24-month period. Since then, the European sovereign debt crisis has aggravated international threats to the U.S. economy. Moreover, the Japanese earthquake and tsunami demonstrated that the U.S. economy is vulnerable to outside disruptions. Updated forecasts suggest that the probability of a U.S. recession has remained elevated and may have increased over the past year, in part because of foreign financial and economic crises.

Gathering storms across the Atlantic threaten a U.S. economy not yet recovered from the last recession. The September Economic Outlook from the Organisation for Economic Co-operation and Development (OECD) indicates that growth prospects have significantly dimmed for major industrialized economies (OECD 2011). Growth in the G-7 countries is expected to remain below 1% for the rest of the year, while the odds of a contraction are fifty-fifty. The semiannual Global Financial Stability Report of the International Monetary Fund (IMF) highlights risks the European sovereign debt crisis poses to the stability of the financial system (IMF 2011a). The crisis has resulted in escalating volatility in equity markets and the lowest interest rates on long-term U.S. Treasury securities since the 1940s. In its World Economic Outlook, the IMF sees the softening U.S. economy and the euro area fiscal crisis as the two major factors threatening the world economy (IMF 2011b).

On cue, economic forecasters have been flourishing their recession trumpets, sounding a symphony of predictions that put the odds of a U.S. recession in the neighborhood of one in three over the next twelve months. In this Economic Letter, we join this ensemble, updating the recession probabilities provided last year in Berge and Jordà (2010). In that Economic Letter, we put the odds of recession at about one in three by the end of the summer of 2011, rising to even odds of one in two toward the first half of 2012. Measured by the growing number of forecasters who now share our views, these predictions have held up well.

Since the summer of 2010, the situation on the ground has changed. Japan’s March 2011 earthquake and tsunami disrupted supply chains in the U.S. automobile industry far more than expected. Meanwhile, the deteriorating fiscal realities in Europe have been keeping many a trader awake at night, reliving the nightmare of the near-collapse of financial markets in the wake of the Lehman Brothers bankruptcy. The European situation was highlighted by the September 2011 release of the euro zone purchasing managers index data, which indicated that the manufacturing and services sectors contracted in August. Christine Lagarde, the IMF’s managing director, sounded the financial alarm by suggesting that European banks are in “urgent need of capital” in a speech on August 27 at the Federal Reserve’s Jackson Hole Economic Policy Symposium.

This Economic Letter revises the recession odds calculated in 2010 to account for these international factors. Viewed through the domestic lens, the immediate risks of recession appear to be low, but gradually increasing. International risks, though less precisely measured, are the mirror image. Risks are highest in the very short run, but then fade. In combination, the data suggest vigilance. The U.S. economy is fragile with limited ability to withstand shocks. Yet, as the economy strengthens, recession risks will gradually abate beginning in the second half of 2012.

Updating the recession odds based on the leading indicators index

Why should anyone care about dating expansions and recessions? When millions of workers are unable to find a job during a period of expansion, it seems little more than an academic exercise. It would be more compelling to quantify the odds that the rate of GDP growth will exceed a level at which the jobs picture can reasonably be expected to improve, say, 2%.

However, identifying business cycle turning points is useful. From an operational viewpoint, predicting a binary outcome—recession or expansion—over a long forecast horizon is easier than predicting GDP. Moreover, certain variables, such as leading economic indicators, offer insight into recession odds in the distant future. If economic policy is to be preemptive rather than reactive, it is important to get ahead of the curve.

In Berge and Jordà (2010), we used the components of the Conference Board’s Leading Economic Index (LEI) (www.conference-board.org/data/bci.cfm) to forecast the odds of recession. We assembled different LEI indexes based on weighted averages of the components, tailored to reflect that different variables have predictive power at different horizons.

Historically, the interest spread between the federal funds rate and the yield on the 10-year U.S. Treasury bond had been one of the better predictors of turning points. But the extraordinary combination of the federal funds rate stuck near its zero lower bound and extremely low Treasury bond yields, reflecting uncertainty about European sovereign debt more than domestic fundamentals, have kept the spread unusually narrow. We continue to view this signal as misleading in the current environment and have chosen to drop it from the update, just as we did in 2010.

One way to assess the accuracy of predictions about turning points is to rely on a statistic that has a long tradition in biostatistics and medicine called the area under the curve (AUC). The AUC is a number between 0.5, a prediction no better than a coin toss, and 1, a perfect sorting of recessions and expansions. One interpretation of the AUC is as the average correct classification rates of observations as either expansions or recessions (for more on the AUC, see Berge and Jordà 2011).

At the short end of our 24-month forecasting exercise, the AUC is 0.99, which means we can almost perfectly determine whether we are in recession. At about a year out, the AUC is 0.75, which, loosely interpreted, means we can correctly sort expansions and recessions with 75% accuracy. At the two-year mark the AUC is 0.81, a surprising improvement in accuracy reflecting that the leading indicators are well suited for that horizon.

The American business cycle in international context

Fluctuations in U.S. economic activity sometimes have an international component. The oil crises after OPEC’s oil embargo in 1973 and the Iranian revolution in 1979 engulfed a large portion of the global economy. Although financial crises in advanced economies are rare, they can leap continents and borders with tremendous facility, as we learned in 2008. It is tempting to think that such contagion is a modern phenomenon. However, using a data set spanning 140 years, Jordà, Schularick, and Taylor (2011) have identified five such financial crises. In each case, 9 to 10 countries out of a sample of 14 advanced economies were dragged into the financial maelstrom. Will the European sovereign debt crisis evolve into one of these events? If so, what would be the risks to the U.S. economy?

The approach we use largely resembles that based on the domestic LEI data discussed earlier. The OECD prepares a composite leading indicators (CLI) index for each of its member countries to detect country-specific turning points (see www.oecd.org/std/cli). These differ for each country depending on data availability and each indicator’s ability to project country-specific turning points.

Figure 1
Probability of a U.S. recession using CLI data

Probability of a U.S. recession using CLI data

We examine to what extent international data on leading indicators are able to detect U.S. turning points using combined CLI data for Canada, France, Germany, Japan, and the United Kingdom. We begin by separating any information that is correlated with the U.S. CLI, which is calculated by the OECD as well. This separation avoids double counting information that already appears in our domestic LEI analysis.

Figure 1 displays the U.S. recession probabilities calculated with these data. The AUC hovers around 0.7 over the entire 24-month forecast range. Thus, the foreign CLI data provide a surprisingly reasonable signal of U.S. recessions. In normal times, this signal is lower quality than the LEI-based signal and would be superseded. But what if these are not normal times?

Calculating recession odds due to domestic and external factors

Figure 2 shows our updated recession probability forecasts. The thin red line shows the LEI-based predictions we calculated in 2010, which run until 2012. The black dashed line shows the LEI-based predictions using data through August 2011 and extends until mid-2013. The dotted green line shows the predictions based on international CLI data released through July 2011. The thick blue line displays the odds of recession based on combining the lines based on domestic and international factors.

To interpret these predictions, think about an experiment in which two coins are flipped, with heads representing recession and tails expansion. One coin represents the recession odds from domestic factors, the other coin from international factors. Figure 2 shows the probabilities of flipping heads with the domestic and international coins. The overall probability of recession is reflected in the thick blue line.

In the next few months, the odds of recession due to domestic factors appear reasonably contained. Those odds increase gradually and reach about 30% in the second half of 2012, after which they decline. However, the curve reflecting the international odds suggests more imminent danger to the economy, although this threat is harder to calibrate using historical data and only indirectly reflects the health of the European financial system. Recession odds based on international factors peak at about 45% toward the end of 2011, but decline rapidly thereafter.

Figure 2
Recession probability forecasts

Recession probability forecasts

The combination of these two recession coins, shown in the combined risks line of Figure 2, is quite disconcerting. It indicates that the odds are greater than 50% that we will experience a recession sometime early in 2012. Because the international odds of recession are more imprecisely estimated, one must be careful with a strict interpretation of this result. But the message is clear. Prudence suggests that the fragile state of the U.S. economy would not easily withstand turbulence coming across the Atlantic. A European sovereign debt default may well sink the United States back into recession. However, if we navigate the storm through the second half of 2012, it appears that danger will recede rapidly in 2013.

Travis J. Berge is an economist in the Research Department of the Federal Reserve Bank of Kansas City.

Early Elias is a research associate in the Economic Research Department of the Federal Reserve Bank of San Francisco.

Òscar Jordà is a research advisor in the Economic Research Department of the Federal Reserve Bank of San Francisco.


References

Balduzzi, Pierluigi, Edwin J. Elton, and T. Clifton Green. 2001. “Economic News and Bond Prices: Evidence from the U.S. Treasury Market.” Journal of Financial and Quantitative Analysis 36(4), pp. 523–544.

Berge, Travis J., and Òscar Jordà. 2010. “Future Recession Risks.” FRBSF Economic Letter 2010-24. http://www.frbsf.org/publications/economics/letter/2010/el2010-24.html

Berge, Travis J., and Òscar Jordà. 2011. “Evaluating the Classification of Economic Activity into Recessions and Expansions.” American Economic Journal: Macroeconomics 3(2, April), pp. 246–277.

International Monetary Fund. 2011a. “Global Financial Stability Report: Grappling with Crisis Legacies.” World Economic and Financial Surveys, September 2011. http://www.imf.org/external/pubs/ft/gfsr/2011/02/index.htm

International Monetary Fund. 2011b. “World Economic Outlook: Slowing Growth, Rising Risks.” World Economic and Financial Surveys, September 2011. http://www.imf.org/external/pubs/ft/weo/2011/02/index.htm

Jordà, Òscar, Moritz Schularick, and Alan M. Taylor. 2011. “Financial Crises, Credit Booms, and External Imbalances: 140 Years of Lessons.” IMF Economic Review 59(2), pp. 340–378.

Organisation for Economic Co-operation and Development. 2011. Economic Outlook 89 (September 8). www.oecd.org/oecdEconomicOutlook

Goldman Sachs and Downside Risks

Downside Risks

by CalculatedRisk on 11/13/2011 12:47:00 PM

On Friday, Goldman Sachs economists expressed concerns about two potential negative shocks for the U.S. economy:

"We are particularly concerned about two potential negative shocks— one of which has already materialized to some degree. First, a worsening of the European financial crisis would hurt the economic outlook globally. Second, our forecast assumes that the payroll tax cut is extended for another year; if that failed to happen, the fiscal drag in early 2012 would rise significantly."

Goldman Sachs, November 11, 2011

These are downside risks to Goldman's forecast of about 1% GDP growth in the first half of 2012 - already a very weak forecast!

On the second point, additional fiscal stimulus might depend on the so-called "super committee" that has a November 23rd deadline. I have little confidence in the committee. Here is an update from the WaPo: Supercommittee hasn’t ‘given up hope,’ Hensarling says

“We haven’t given up hope,” Rep. Jeb Hensarling (R-Texas) said on CNN’s “State of the Union.” “But if this was easy, the president of the United States and the speaker of the House would have gotten it done themselves.”

It is hard to believe that Congress would raise taxes on working Americans with a 9% unemployment rate, and in an election year - but that just might happen ...

I agree that the European financial crisis and additional fiscal tightening are the two major downside risks, but I think there are several other risks worth mentioning.

Oil and gasoline prices have remained fairly high and there is always the risk of another supply shock in the middle east. Gasoline prices are already at the highest level ever for October and November. Not a great way to start the holiday shopping season.

Another ongoing drag has been state and local government cutbacks. This year, state and local governments have cut 232,000 payroll jobs (about 23 thousand per month). This might continue in 2012 (most forecasts are for cutbacks to slow next year). The California State controller recently reported:

State Controller John Chiang today released his monthly report covering California's cash balance, receipts and disbursements in October, showing revenues came in $810.5 million below projections from the recently passed state budget.

"October's poor revenues capped a very disappointing first four months of the fiscal year," said Chiang. "Unless revenues and expenditures begin to track with projections, the State will face increasing cash pressure in the months ahead."

This shortfall could lead to additional cuts in California next year, and other states are probably falling short too.

And last, but never least, the U.S. housing crisis is ongoing. House prices are now falling again, and there will be more distressed supply coming on the market - especially once the mortgage settlement is reached. It does appear the excess supply is being absorbed (based on falling vacancy rates), but there is still a long way to go.

My general forecast is for sluggish growth, but there are some significant downside risks.

Friday, October 21, 2011

I.H.S. predicts job growth

Which States Are Poised for Jobs Growth?


http://blogs.wsj.com/economics/2011/10/20/which-states-are-poised-for-jobs-growth/

Real Time Economics HOME PAGE »

By Phil Izzo

As the U.S. jobs market digs its way out of the recession, gains aren’t expected to be evenly distributed. But some of the hardest-hit regions may also see some of the best growth, according to a new analysis.

Click for a full-sized interactive map

Forecasting firm IHS Global Insight looked at which states will have the strongest rates of expansion through 2017. The company’s regional economic group made forecasts determined by the macroeconomic outlook, including demographic assumptions, historical and cyclical trends and other factors such as oil prices and tax policy.

Most of the states expected to see the largest employment gains are also states that have seen big gains in population. That’s good news for places like Texas and Utah that have relatively low unemployment rates compared to the national average. It’s still a positive development for growing states such as Florida, Nevada and Arizona, but their higher unemployment means there will be lots of competition for those new jobs.

Some states also seem positioned for strong growth because they were hit so hard by the recession. “Some of the southern states seem poised for growth not so much because they’re booming, but because they’re starting from a lower point with more room to expand,” said Steven Frable of IHS.

But there are also hard-hit states that are going to come back more slowly. Michigan, for example, faced structural problems even before the recession started and there’s little to suggest the state will see strong growth.

California, another state battered by the recession, isn’t expected to experience employment growth much faster than the U.S. average. While some areas will see gains from high-tech and manufacturing jobs moving in, the state has also seen its population growth slow.

Tuesday, October 4, 2011

Goldman Sachs, Jan Hatzius say 40% chance of recession in 2012

Goldman puts U.S. recession probability at 40% in 2012

by CalculatedRisk on 10/04/2011 12:26:00 PM

The following article makes a few key points that we've been discussing:
• It is very unlikely that the U.S. economy was in a technical recession at the end of Q3. In fact, Goldman revised up their Q3 forecast to 2.5% (Merrill Lynch and others revised up their Q3 forecasts too). The recent data suggests sluggish growth, not recession (examples include the ISM manufacturing survey showing expansion in September, the Chicago PMI increasing, and auto sales back up over 13 million SAAR).
• There are clear downside risks to the U.S. economy mostly from the European financial crisis, the apparent renewed recession in Europe, and from U.S. fiscal tightening. However the potential spillover from Europe is difficult to quantify.
• Since the cyclical sectors in the U.S. remain very depressed, it is difficult for those sectors to fall significantly. Usually these sectors decline prior to a recession in the U.S., and that is not happening now.
From Jeff Cox at CNBC: Recession Chance 40% in 2012, Jobless Rate to 9.5%: Goldman

Jan Hatzius, Goldman's chief US economist, pegged recession chances at 40 percent and said the jobless rate is likely to surge to the mid-9 percent range in 2012.
While that still jibes with the firm's forecast that a recession — or two consecutive quarters of negative growth — is not the most likely scenario, the warning signs flashed Tuesday underscore concerns about European debt contagion on an already fragile US economy.
Here are the upside and downside risks from the research note:
The upside risk is that either financial stresses ease--with the most likely cause of this a more aggressive and coordinated move by European policymakers to turn the tide--or that the spillovers from those financial stresses into US credit and financial conditions prove relatively limited. The quickest and easiest way to gauge the former is the behavior of borrowing spreads for sovereigns in the European periphery, and banks in the Eurozone as a whole. ... Without a clear pass-through into domestic financial or credit conditions, the base-case outlook would revert to our previous forecast of trend or slightly-below trend growth in 2012. (The "hard data" on the economy have held up sufficiently well in the third quarter that we now expect 2.5% growth in Q3, from 2.0% previously.)
The downside risk is of course that these financial spillovers--or conceivably some other shock, perhaps greater fiscal tightening in 2012 than we now anticipate--prove sufficient to push the US economy into recession; both a quantitative model and our subjective assessment put recession risk in the neighborhood of 40% at this point. For now, we still think the base case is that the US economy avoids this outcome. The cyclical sectors of the economy are already quite depressed--in particular, homebuilding is barely above the depreciation rate of housing--so downside looks more limited.

Sunday, August 28, 2011

Michael Pettis predictions

Some predictions for the rest of the decade

Forecasts | Michael Pettis | 28 August 2011 18:30


1Share

By Michael Pettis

Markets have been crazy this month, but rather than try to wade through all the news, much of which doesn’t seem to have much informational content, I thought I would duck out altogether and instead make a list of things I expect will happen over the next several years. We are so caught up in noise and market volatility – as the market swings first in one direction and then, as regulators react, in the other direction – that it is easy to lose sight of the bigger picture.

My basic sense is that we are at the end of one of the six or so major globalization cycles that have occurred in the past two centuries. If I am right, this means that there still is a pretty significant set of major adjustments globally that have to take place before we will have reversed the most important of the many global debt and payments imbalances that have been created during the last two decades. These will be driven overall by a contraction in global liquidity, a sharply rising risk premium, substantial deleveraging, and a sharp contraction in international trade and capital imbalances.

To summarize, my predictions are:

  • BRICS and other developing countries have not decoupled in any meaningful sense, and once the current liquidity-driven investment boom subsides the developing world will be hit hard by the global crisis.
  • Over the next two years Chinese household consumption will continue declining as a share of GDP.
  • Chinese debt levels will continue to rise quickly over the rest of this year and next.
  • Chinese growth will begin to slow sharply by 2013-14 and will hit an average of 3% well before the end of the decade.
  • Any decline in GDP growth will disproportionately affect investment and so the demand for non-food commodities.
  • If the PBoC resists interest rate cuts as inflation declines, China may even begin slowing in 2012.
  • Much slower growth in China will not lead to social unrest if China meaningfully rebalances.
  • Within three years Beijing will be seriously examining large-scale privatization as part of its adjustment policy.
  • European politics will continue to deteriorate rapidly and the major political parties will either become increasingly radicalized or marginalized.
  • Spain and several countries, perhaps even Italy (but probably not France) will be forced to leave the euro and restructure their debt with significant debt forgiveness.
  • Germany will stubbornly (and foolishly) refuse to bear its share of the burden of the European adjustment, and the subsequent retaliation by the deficit countries will cause German growth to drop to zero or negative for many years.
  • Trade protection sentiment in the US will rise inexorably and unemployment stays high for a few more years.

There is nothing really new in these predictions for regular readers. These are more or less the same predictions – based largely on historical precedent and the logic of the global balance of payments mechanisms – that I have been making for the past five or six years (the past eleven year, when it comes to the breakup of the euro), but I thought it would be helpful, at least for me, to list them.

Note that although at first glance some of these predictions seem unrelated to others, in fact they all flow from the same basic balance of payments and balance sheet frameworks. To explain each in greater detail:

  • There has been no decoupling of developing economies, or more narrowly the BRICs, from the developed world. All that has happened is that the transmission from one to the other has been delayed.

Since most global consumption comes from the US, Europe and Japan, the collapse in their demand will ultimately be very painful for the BRICs and the rest of the developing world. The latter have postponed the impact of contracting consumption by increasing domestic investment, in some cases very sharply, but the purpose of higher current investment is to serve higher future consumption. In many countries, most notably China, the higher investment will itself limit future consumption growth, and so with weak consumption growth in the developed world, and no relief from the developing world, today’s higher investment will actually exacerbate the impact of the current contraction in consumption.

This delayed transmission, by the way, is not new. It also happened in the mid-1970s with the petrodollar recycling. Economic contraction in the US and Europe in the early and mid 1970s did not lead immediately to economic contraction in what were then known as LDCs, largely because the massive recycling of petrodollar surpluses into the developing world fueled an investment boom (and also fueled talk about how for the first time in history the LDCs were immune from rich-country recessions). When the investment boom ran out in 1980-81, driven by the debt fatigue that seems to end all major investment booms, LDCs suffered the “Lost Decade” of the 1980s, especially those who suffered least in the 1970s by running up the most debt.

This time around a huge recycling of liquidity, combined with out-of-control Chinese fiscal expansion (through the banking system), has caused a surge in asset and commodity prices that will have temporarily masked the impact of global demand contraction for BRICs. But it won’t last. By the middle of this decade the whole concept of BRIC decoupling will seem faintly ridiculous.

  • By 2013 Chinese household consumption will still not have exceeded the 35% of Chinese GDP reached in 2009. In fact it will probably be lower.

For much of the past decade there has been a growing recognition that Chinese growth has been seriously unbalanced, as Premier Wen put it, and that at the heart of the imbalance has been the very low consumption share of GDP. In 2005, when consumption hit the then-astonishing level of 40% of GDP, there was a widespread conviction in policy-making circles that this was an unacceptably low level and that it left Chinese growth much too dependent on the trade surplus and on increases in domestic investment. At the time the former seemed a more dangerous risk than the latter – although even then massive overinvestment was China’s true vulnerability – but I think by now there is a rapidly developing consensus that investment, and the unsustainable concomitant increase in debt, is China’s biggest problem.

That is why Premier Wen listed the need to raise the consumption share of GDP second in his speech last March before the unveiling of the new Five-Year Plan. This time, the message seems to be, they are serious about doing it.

But I remain very, very skeptical. Low consumption levels are not an accidental coincidence. They are fundamental to the growth model, and the suppression of consumption is a consequence of the very policies – low wage growth relative to productivity growth, an undervalued currency and, above all, artificially low interest rates – that have generated the furious GDP growth. You cannot change the former without giving up the latter. Until Beijing acknowledges that it must dramatically transform the growth model, which it doesn’t yet seemed to have acknowledged, consumption will continue to be suppressed.

  • In the rest of 2011 and during all of 2012 Chinese debt levels will continue to rise very quickly, in spite of attempts to slow the growth in debt.

The attempts to rein in debt growth will fail because they address specific areas of debt and not the overall tendency of the system to generate debt. So although there may be more pressure to rein in local government borrowing, for example, this will probably fail, and if it succeeds it will only be because other entities, most probably locally-controlled SOEs, are enlisted to fill in the gap. My guess is that next year the general alarm among investors will have switched from local government debt to SOE debt, not because the former will have become manageable, but rather because the latter will surge, albeit in not-always-transparent ways.

With consumption growth constrained and the external environment unsound, increasing investment is the only way to keep GDP growth rates high. China funds almost all of its major investments with bank debt, and it long ago ran out of obvious investments that are economically viable – at least investments that are likely to be generated by what is a distorted system with very skewed incentives – so increases in investment must be matched by increases in debt.

To the extent that investments are not economically viable, this means that the value of debt correctly calculated must rise faster than the value of assets. By definition this results in an unsustainable rise in debt.

  • By 2013-14 Chinese GDP growth will slow sharply, and by 2015-16 predictions of a sustained period of growth rates at 3% or lower will no longer seem outlandish.

I don’t expect a significant growth slow-down until after the new leadership takes power in late 2012, but my guess (and hope) is that by 2013 the stubborn refusal of consumption to rise as share of GDP, and the continuing surge in debt, will have convinced all but the most recalcitrant that China needs a dramatic change of policy. The longer we wait, the more debt there will be and the more pressure there will be on Beijing to use household wealth transfers to service the debt.

Why do I say we will be talking about 3% growth soon? Two reasons. First, I am impressed by the bleakness of historical precedents. Every single case in history that I have been able to find of countries undergoing a decade or more of “miracle” levels of growth driven by investment (and there are many) has ended with long periods of extremely low or even negative growth – often referred to as “lost decades” – which turned out to be far worse than even the most pessimistic forecasts of the few skeptics that existed during the boom period. I see no reason why China, having pursued the most extreme version of this growth model, would somehow find itself immune from the consequences that have afflicted every other case.

Second, I just use a very simple calculus. Remember that rebalancing is not an option for China. It will happen one way or the other, and the sooner the less disruptive. And for China to rebalance in a meaningful way, consumption growth is going to have to outpace GDP growth by at least 3-4 full percentage points (and even then, at that rate, it will take China over five years to return to the 40% that was not long ago considered astonishingly low).

During the boom of the last decade consumption has grown at a very sharp 7-8% annually. If consumption growth remains at that level, China can slowly rebalance with GDP growth of 4-5%. But historical precedent (along perhaps with common sense) suggests that if GDP growth drops so sharply, from 10-11% to 4-5%, it will be incredibly difficult for household income and household consumption growth to be maintained. In that case a 2-3% drop in household consumption growth may be a fairly conservative estimate, and as the growth rate declines, GDP growth will also decline with it. I discuss this more in a WSJ OpEd piecelast week.

  • The decline in Chinese growth will fall disproportionately on investment and, because of this, it will severely impact the price of non-food commodities.

In the past, as the consumption share of GDP declined sharply, the investment share rose. By definition as China rebalances, this process must reverse. This must mean that consumption growth will speed up (relatively, at least) and investment growth decline even if overall GDP growth remains unchanged. Of course if GDP growth drops, as it absolutely must, investment growth must drop even more.

The implications are inescapable, although I think many people, especially in the commodities sector, have missed them. If GDP growth drops by X%, investment growth must drop by substantially more than X%. This is what rebalancing means.

What happens to real interest rates will determine when the process of Chinese adjustment begins. In fact there is a chance that we may see growth in China slow significantly in 2012, perhaps even to 7%, although I suspect that it will probably be in the 8-9% region.

This is a bit of wild speculation on my part, but depending on what the PBoC is allowed to do with interest rates, we may see the beginnings of an adjustment as early as next year. In the past year the PBoC has raised interest rates by roughly 125 basis points. Obviously, as I have argued many times, this has not been nearly enough given the much higher increase in inflation and it is part of the reason why the domestic imbalances have seemed to have gotten worse in the past year, not better.

But I expect that inflation will begin to decline soon, and it may even drop quite sharply. In that case what will the PBoC do to interest rates? If they can refrain from lowering them, the higher interest rates will reduce overinvestment while putting more wealth into the pockets of household deposits. This will both slow growth and speed up rebalancing.

Will it happen? I have no idea. What the PBoC does to interest rates is likely to be the outcome of a struggle in the State Council between policymakers that are worried about growth and those that are worried about imbalances. If the PBoC can hold off the former, and especially if wages continue rising, we might begin to see Chinese rebalancing taking place a little earlier than expected. Of course this must, and will, come with much slower GDP growth.

  • Growth rates of 3% will not necessarily lead to social and political instability. Most analysts argue that China needs annual growth rates of at least 8% to maintain current levels of unemployment. Anything substantially lower will cause unemployment to surge, they argue, and this would lead to social chaos and political instability.

I disagree. The employment effect of lower growth depends crucially on the kind of growth we get. The problem is that China’s current growth model encourages a heavily capital-intensive type of growth – wholly inappropriate, in my opinion, for such a poor country.

But since rebalancing in China requires less emphasis on heavy investment and more on consumption, and since rebalancing also means a sharp reduction in free credit provided to SOEs and local governments and cheaper and more available credit for efficient but marginal SMEs, a rebalancing China would presumably see much more rapid growth in the service sector and in the SME sector, both of which are relatively labor intensive. Much lower growth, in that case, could easily come with minimal changes in overall employment.

That is why Japan is a useful reminder of what can happen. After 1990 GDP growth collapsed from two decades of around 9% on average to two decades of less than 1% on average, but there was no social discontent, and unemployment didn’t surge. Some analysts credited Japanese lifetime employment or invoked the natural docility of Japanese people (a bizarre argument at best) to explain the lack of social upheaval, but for me it was because Japan genuinely rebalanced in the past two decades.

Before 1990 GDP growth sharply outpaced consumption growth, whereas after 1990 their positions were reversed – consumption growth sharply outpaced GDP growth. In that time the Japanese savings rate declined sharply, the household income share of GDP rose sharply, and Japan became less dominated by the industrial giants that were almost synonymous with Japan of the 1980s.

So as I see it the Japanese didn’t react to Japan’s “collapse” with outrage or horror largely because Japan didn’t really collapse in any meaningful sense. Japanese standards of living on average continued to rise after 1990, and on a real per capita basis probably only a little slower than they had before 1990. It was the state sector that bore most of the brunt of the slower growth, and this shows up as the explosion in government debt. Households were fine because although the GDP pie was growing at a much slower rate after 1990 than before, their share of the pie was growing after 1990, whereas it shrank before 1990.

I think the same might happen, or at least could happen, in China. It depends in part on how resistant the elites are to the process of rebalancing, which almost by definition means eliminating the distortions that had benefitted them for so long. As Jeffrey Frieden pointsout in his brilliant Debt, Development and Democracy (1992), the elites that benefit from economic distortions are traditionally the ones most likely to prevent necessary adjustments, and if they actually run the whole show, adjustment can be incredibly painful and disruptive.

If I am right, and China begins to rebalance (and it has no choice but to rebalance unless it has infinite borrowing capacity and the world has infinite appetite for Chinese surpluses), then the debate must shift from economics to politics. We need to understand how and under what conditions China’s elite will permit an elimination of the distortions that benefitted them. For example, under what conditions will the export sector and its defenders allow the RMB to rise, or will SOEs and provincial governments tolerate an increase in interest rates, and so on?

  • Because of its rapidly rising debt burden, the only way for China to manage a smooth social transition will be through wealth transfers from the state sector to the household sector. In the past, Chinese households received a diminishing share of a rapidly growing pie. In the future they must receive a growing share. This will probably be accomplished through formal or informal privatization.

The right way to engineer the transition to a system in which household wealth isn’t used to subsidize growth is to raise wages, raise the value of the currency, eliminate SOE monopoly pricing, and raise interest rates. The problem is that all of these have to adjust so far that to do so quickly would lead to massive financial distress. It would also lead to rising unemployment and, with it, declining consumption, so that the rebalancing would occur through low consumption growth and perhaps negative GDP growth. No one wants this outcome.

Doing so slowly, however, so as not to cause financial distress and a surge in unemployment will result in worsening imbalances over the medium term. It will also lead to a continued building up of debt – and I think we only have four or five more years of this kind of debt build-up before we hit the debt crisis that every other investment-driven growth miracle country has faced.

So what can Beijing do? They’re damned if they go slowly and they’re damned if they go quickly. There is however an alternative solution that is relatively easy (easy economically, not politically). It is to increase household wealth through a one-off transfer from the state sector. The state can privatize assets and use the proceeds either to increase household wealth directly (gifts of shares, improvement in the social safety net, etc.) or indirectly (clean up the banking system and pay down debt).

Right now it is hard to find anybody who really thinks Beijing will engage in a massive privatization program, but this is the only logical alternative I can come up with, and it is the least painful. So my guess is that in two or three years privatization will become a very popular topic of policy discussion.

  • European politics will become much more difficult and disruptive. The historical precedents are clear. During a debt crisis the political system becomes fragmented and contentious. If the major parties don’t become radicalized, smaller radical parties will take away their votes.

Remember that the process of adjustment is a political one. We all know someone has to pay for the massive adjustment countries like Spain must make. The only interesting question is about who will be forced to take the brunt of the payment – workers in the form of unemployment, the middle classes in the form of confiscated savings, small businesses in the form of taxes, large businesses in the form of taxes and nationalization, foreigners, or creditors.

Deciding who pays is a political process, and because the stakes are so high it will be a very bitter process. This means, among other things, that politics will degenerate quickly, and of course if Europe doesn’t arrive at fiscal union in the next year or two, it probably never will. This conclusion is also the reason for my next prediction.

  • Spain will leave the euro and will be forced to restructure its debt within three or four years. So will Greece, Portugal, Ireland and possibly even Italy and Belgium.

Once the market determines that debt levels are too high, then debt levels become too high, and without a deus ex machina the results are predictable. All the major economic agents begin to behave in ways that worsen the debt crisis until finally the country slides into default. Businesses will disinvest, creditors will demand shorter and riskier maturities, workers will strike, politicians will shorten their time horizons, and banks won’t lend.

In that case, with incentives lines up so that all the major economic agents worsen the debt problem, debt must rise faster than both GDP and the country’s debt-servicing ability. The worse the debt level gets, the faster debt rises relative to GDP. What’s more, the only strategies by which Spain can regain competitiveness are either to deflate and force down wages, which will hurt workers and small businesses, or to leave the euro and devalue. Given the large share of vote workers have, the former strategy will not last long. But of course once Spain leaves the euro and devalues, its external debt will soar. Debt restructuring and forgiveness is almost inevitable.

  • Unless Germany moves quickly to reverse its current account surplus – which is very unlikely – the European crisis will force a sharp balance-of-trade adjustment onto Germany, which will cause its economy to slow sharply and even to contract. By 2015-16 German economic performance will be much worse than that of France and the UK.

If Germany does not take radical steps to push its current account surplus into deficit, the brunt of the European adjustment will fall on the deficit countries with a sharp decrease in domestic demand. This is what the world means when it insists that these countries “tighten their belts”.

If the deficit countries of Europe do not intervene in trade, they will bear the full employment impact of that drop in demand – i.e. unemployment will continue to rise. If they do intervene, they will force the brunt of the adjustment onto Germany and Germany will suffer the employment consequences.

For one or two years the deficit countries will try to bear the full brunt of the adjustment while Germany scolds and cajoles from the side. Eventually they will be unable politically to accept the necessary high unemployment and they will intervene in trade – almost certainly by abandoning the euro and devaluing. In that case they automatically push the brunt of the adjustment onto the surplus countries, i.e. Germany, and German unemployment will rise. I don’t know how soon this will happen, but remember that in global demand contractions it is the surplus countries who always suffer the most. I don’t see why this time will be any different.

About a week after I set down these “predictions”, and two days after I finished this point, I saw in the Financial Times that German growth has already hit a wall. Expect to see a lot more articles like this over the next few years.

  • As the US fights over the fiscal deficit and whether or not it is the right way to expand domestic demand, more and more politicians will focus on the expansionary impact of trade protection. There will be an increasing tendency to intervene in trade – in fact I think of quantitative easing as a policy aimed at trade and currency imbalances as much as one aimed at domestic monetary management.

As unemployment persists, and as the political pressure to address unemployment rises, the US will, like Britain in 1930-31, lose its ideological commitment to free trade and become increasingly protectionist. Also like Britain in 1930-31, once it does so the US economy will begin growing more rapidly – thus putting the burden of adjustment on China, Germany (which will already be suffering from the European adjustment) and Japan.

Trade policy in the next few years will be about deciding who will bear the brunt of the global contraction in demand growth. The surplus countries, because they are so reliant on surpluses, will be very reluctant to eliminate their trade intervention policies. Because they are making the same mistake the US made in the late 1920s and Japan in the late 1980s – thinking they are in a strong enough position to dictate terms – they will refuse to take the necessary steps to adjust.

But in fact in this fight over global demand it is the deficit countries that have all the best cards. They control demand, which is the world’s scarcest and most valuable commodity. Once they begin intervening in trade and regaining the full use of their domestic demand, they will push the adjustment onto the surplus countries. Unemployment in deficit countries will drop, while it will rise in surplus countries.

This is an abbreviated version of the newsletter that went out two weeks ago. Academics, journalists, and government and NGO officials who want to subscribe to the newsletter should write to me at chinfinpettis@yahoo.com, stating your affiliation, please. Investors who want to buy a subscription should write to me, also at that address.

Thursday, August 25, 2011

Congressional Budget Office Projections:

Five Trillion Dollars

A couple of notes on the most recent Congressional Budget Office Projections:

1. They offer a portrait of an economic catastrophe. Here’s the CBO estimates of potential real GDP — the amount the economy could produce without causing inflationary pressure — and actual GDP, in trillions of 2005 dollars per year:

No, I don’t know where that recovery in 2015 is supposed to come from; my guess is that it’s basically the CBO unwilling to project a depressed economy more or less forever. But even with that bounceback assumed, the projection says that we’ll have a cumulative output gap of $5.1 trillion, with $2.8 trillion of that having already happened.

Surely it would have been worth making an extraordinary effort to avoid this outcome. In particular, an $800 billion stimulus, a significant fraction of which was stuff that would have happened anyway (like extending the patch on the alternative minimum tax) looks ludicrously underpowered. Yet policy has been timid and conventional.

2. The CBO also projects unemployment staying above 8 percent until late 2014 — again, with no clear explanation of why it should fall sharply in 2015. This translates into a human catastrophe for the long-term unemployed. It also says that there will be no good reason to raise interest rates for the foreseeable future.

I think if you had told people back in, say, 2007 that this would happen, they would have asserted with confidence that generating a faster recovery would be at the top of the political agenda. The fact that it isn’t — that deficits are still dominating the conversation, even as interest rates plumb record lows — is truly remarkable.

Friday, August 19, 2011

Top banks lower forecasts for 2011 2H and 2012

More downward revisions to economic forecasts

by CalculatedRisk on 8/19/2011 09:20:00 PM

Below are some downward forecast revisions released last night and today. If these forecasts are close, then the unemployment rate will probably increase over the next few quarters too ...
• From Wells Fargo today:

Based on the evidence we have reviewed ... we have concluded there are now significant downside risks to economic growth over the near term. Our forecast now calls for real GDP to rise 1.6 percent in 2011 and 1.1 percent in 2012 ... it is entirely possible the current downward spiral in the economy and financial markets will become self-reinforcing. We will be monitoring high frequency data for further signs of economic deterioration and revise our outlook as needed.
• From Goldman Sachs today:
In light of the downshift in the data this week, we are cutting our second-half growth forecasts further. We now expect GDP growth of 1.0% in Q3 and 1.5% in Q4, both down from 2.0% previously.
• From JPMorgan via MarketWatch: J.P. Morgan further cuts U.S. growth forecast (ht jb)
Economists at J.P. Morgan on Friday further cut estimates for U.S. economic growth and warned that recession risks are "clearly elevated." While the outlook for third-quarter growth looks only "moderately softer" than previously projected, the economists, in a research note, said they have slashed the outlook for fourth-quarter growth to 1% from a previous projection of 2.5%. They also lowered their first-quarter 2012 growth forecast to 0.5% from 1.5%.
• From Citigroup last night via Bloomberg: U.S. Economic Growth Estimates Cut at Citigroup
[Citigroup analysts] cut its 2011 gross domestic product growth forecast to 1.6 percent from 1.7 percent and lowered its 2012 GDP growth estimate to 2.1 percent from 2.7 percent.

Tuesday, June 28, 2011

How Easy Is It to Forecast Commodity Prices?

June 27, 2011

34Share

How Easy Is It to Forecast Commodity Prices?

Jan J. J. Groen and Paolo A. Pesenti
Over the last decade, unprecedented spikes and drops in commodity prices have been a recurrent source of concern to both policymakers and the general public. Given all the recent attention, have economists and analysts made any progress in their ability to predict movements in commodity prices? In this post, we find there is no easy answer. We consider different strategies to forecast near-term commodity price inflation, but find that no particular approach is systematically more accurate and robust. Additionally, the results warn against interpreting current forecasts of commodity prices upswings as reliable and dependable signals of future inflationary pressure.

    Policymakers worldwide have long stressed the relevance of this issue. For instance, in a June 2008 speech titled “Outstanding Issues in the Analysis of Inflation,” Federal Reserve Chairman Ben Bernanke emphasized the importance of both forecasting commodity price changes and understanding the factors that drive those changes. At the time of the speech, inflationary pressures were very much on the minds of monetary policymakers across the globe. Oil prices, already on a steep upward trend between 2003 and 2006, actually accelerated and more than doubled in the following quarters. Food prices, particularly for corn, wheat, rice, and soybeans, rose by about 50 percent over the same time horizon. Later, the near-collapse of trade worldwide led to a plunge in energy, metals, and agricultural prices and gave rise to severe disinflation, or even deflation, risks. Most recently, a rally in commodity prices is resurrecting inflationary fears, especially in emerging-market economies.
    In our NBER conference volume paper, “Commodity Prices, Commodity Currencies, and Global Economic Developments,” we do not attempt to answer questions such as “why are commodity prices so persistently high or low?” or “when will they start affecting inflation expectations?” Our purpose is more modest in that we assess how the information from a large dataset of indicators of global conditions may help predict future movements in commodity prices. Our forecast variables are cross-commodity price indexes, that is, we consider ten indexes taken from four distinct sources going back as far as 1973. Before we discuss our results, it may be useful to summarize briefly the approaches usually adopted to forecast commodity prices.
Alternative forecasting approaches
The first approach argues that economic modeling is not particularly helpful. The best information one can use to predict future prices is what is already embedded in current and past prices. Thus, to obtain the best out-of-sample prediction one could just estimate a simple statistical autoregressive process (what goes up must come down) or a random walk specification (the best forecast of tomorrow’s prices are today’s prices). A similar emphasis on simple statistical processes has proven remarkably powerful in the analysis of several asset classes, from stock prices to exchange rates. Let’s call this the “atheist” approach, as only historical information embedded in a commodity price is used for forecasting.
    At the opposite extreme is the claim that commodity prices would be easily predictable if only one used the right tools, the right theory, the right model. Let’s call this the “true believer” approach. Examples of this approach are:

  • Predictions based on observed or expected movements in fundamentals, such as strong demand growth confronting stagnating world production and little spare capacity due to past sluggish investment. Because commodity markets are characterized by relatively inelastic demand, even small revisions in the expected path of future supply expansion can have large and highly volatile effects on prices.
  • Forecasts focused on speculative behavior in the futures markets. The claim here is that speculative strategies that drive commodity futures prices up must be reflected in higher spot prices today regardless of long-term fundamentals; otherwise, agents would have an incentive to accumulate inventories that could be sold later at higher prices. Such forward-looking behaviors are likely to be stronger in an environment of rapid declines in short-term interest rates, when the opportunity cost of physical commodity holding is relatively low, and investors in money-market instruments seek higher yields in alternative asset classes such as commodity derivatives.
  • Emphasis by some market observers that exchange rate fluctuations of relatively small and predominantly commodity-exporting economies such as Australia, Chile, or South Africa are privileged predictors of future global commodity prices. Primary commodity products represent significant components of output in the above-mentioned countries, affecting a large fraction of their export earnings. At the same time, these countries are too small to have much of an impact on world markets. This observation implies that global commodity price changes represent external shocks for these countries, and their exchange rates move today in anticipation of future terms of trade adjustment.

    Finally, some are unwilling or unable to choose among the glut of “true beliefs.” Let’s call this approach “agnostic” (whatever works, we'll take it). Pragmatically, this approach translates into throwing into the cauldron of possible predictors disparate things such as macroeconomic time series across major developed and developing countries (for example, industrial production, business and consumer confidence data, retail sales volumes, money aggregates, and interest rates), data on inventories and production of industrial metals and energy commodities, and data on ocean shipping costs across many different routes. To distill the relevant information from such a brew of raw data, we follow the approach in our FRBNY working paper “Revisiting Useful Approaches to Data-Rich Macroeconomic Forecasting” and use partial least squares (PLS) regressions which, in essence, take those linear combinations of predictors in our large dataset that have maximum explanatory power for future commodity price changes. The main advantage of this approach is that it tends to outperform empirically the more traditional principal components-based methodologies—where predictor combinations would be constructed in isolation (of future commodity price changes or any other variable).
    To summarize, we obtain different sets of forecasts based on different “atheist,” “true-believer,” or “agnostic” approaches.
And the winner is . . .
Well, there is no obvious winner. Information from large panels of global economic variables can help, but their forecasting properties are by no means overwhelming. It all depends on the choice of the specific index and the forecasting horizon. For example, for one specific commodity price index, PLS regressions provide significantly better predictions than both autoregressive and random walk benchmarks when used to forecast one-month and one-quarter-ahead commodity prices. But when the forecasting horizon is six months or longer, the forecast performance of PLS regressions is no better than the statistical benchmarks. PLS does perform relatively better with aggregate commodity price indexes than with commodity subindexes such as metals or energy.
    If we focus on specific subsets of explanatory variables—as emphasized by the “true believers”—we do find some, but not overwhelming, evidence for the notion that commodity currencies are useful predictors. We find even less empirical support for the notion that commodity futures have strong predictive power.
    Ultimately, the basic message is one of inconclusiveness. No easy generalization or pattern emerges, and the results look almost random. In fact, we are unable to generate forecasts that are, on average, more accurate and robust than those based on autoregressive or random walk specifications. If a policy lesson can be drawn from our results, it is that one should be very cautious when interpreting the forecast of a forthcoming commodity price surge as an early signal of recrudescence in global headline inflation. As forecasts of commodity prices provide only highly noisy hints about their actual future trajectories and persistence, excessive confidence in such forecasts may bias policymakers' views and beliefs about future inflation risks in the direction of a premature—and unwarranted—tightening of the global policy mix.
Disclaimer
The views expressed in this blog are those of the author(s) and do not necessarily reflect the position of the Federal Reserve Bank of New York or the Federal Reserve System. Any errors or omissions are the responsibility of the author(s).

Monday, June 27, 2011

Why economists see a stronger second half for 2011

Why economists see a stronger second half for 2011

Why economists see a modestly stronger second half for 2011 after a dismal 6 months

ap

Convenience story owner Floyd Bisson, lowers the price of regular gas at the pumps in front of his store in Phippsburg, Maine on Monday, June 27, 2011. The nationwide average for retail gasoline fell to $3.57 per gallon Monday according to AAA, Wright Express and the Oil Price Information Service. Prices have dropped 24 cents in a month. (AP Photo/Pat Wellenbach)

Paul Wiseman and Christopher S. Rugaber, AP Economics Writers, On Monday June 27, 2011, 4:44 pm EDT

WASHINGTON (AP) -- Farewell and good riddance to the first half of 2011 -- six months that are ending as sour for the economy as they began.

Most analysts say economic growth will perk up in the second half of the year. The reason is that the main causes of the slowdown -- high oil prices and manufacturing delays because of the disaster in Japan -- have started to fade.

"Some of the headwinds that caused us to slow are turning into tail winds," said Mark Zandi, chief economist at Moody's Analytics.

For an economy barely inching ahead two years after the Great Recession ended, the first half of 2011 can't end soon enough. Severe storms and rising gasoline prices held growth in January, February and March to a glacial annual rate of 1.9 percent.

The current quarter isn't shaping up much better. The average growth forecast of 38 top economists surveyed by The Associated Press is 2.3 percent.

The economy has to grow 3 percent a year just to hold the unemployment rate steady and keep up with population growth. And it has to average about 5 percent growth for a year to lower the unemployment rate by a full percentage point. It is 9.1 percent today.

As welcome as the stronger growth envisioned in the second half is, the improvement should be modest. For the final six months of the year, the AP economists forecast a growth rate of 3.2 percent.

So far this year, high gas and food prices have discouraged people from spending much on other things -- from furniture and appliances to dinners out and vacations. That spending fuels economic growth.

And some U.S. auto factories had to suspend or trim production after the March earthquake in Japan interrupted supplies of parts and electronics. American dealerships have had fewer cars to sell.

The latest dose of glum news: The government reported Monday that consumer spending was about the same in May as in April, the first time in a year that spending hasn't increased from the previous month.

The report confirmed the toll that high gas prices, Japan-related disruptions and high unemployment have taken on personal spending in the second quarter.

"Here's to a better third," says Jennifer Lee, senior economist at BMO Capital Markets.

Relief is in sight, economists say. Oil prices have been falling since Memorial Day. The drop has lowered the price of regular unleaded gasoline by 23 cents in the past month, to a national average of $3.57 a gallon, according to AAA.

The timing of the drop in gas prices is especially fortunate because they usually rise during summer driving season, says Robert DiClemente, chief U.S. economist at Citigroup.

And the kinks in the global manufacturing chain are starting to be smoothed out as the Japanese factories that make cars and electronics resume production.

Diane Swonk, chief economist at Mesirow Financial, says auto sales should improve "quite substantially" later this year because the lost production from the earthquake is coming back faster than had been expected.

One sign of that rebound came when the Federal Reserve Bank of Chicago reported Monday that manufacturing in the Midwest rebounded in May after falling sharply in April.

And last week, the government said orders for machinery, computers, cars and other durable goods rose slightly in May after dropping in April. Economists attributed the turnaround, in part, to Japanese factories that started to rev up.

The U.S. economy is also expected to get a slight second-half boost from reconstruction in flood-ravaged sections of the South and Midwest. Construction workers will be employed rebuilding homes and businesses. People will replace destroyed cars and other possessions. Analysts predict the economic losses from the floods in the April-June quarter will be reversed in the July-September quarter.

The economists surveyed by AP predict unemployment will fall to 8.7 percent at year's end. It is not exactly the start of a boom: The economy is still carrying too much baggage from the financial crisis -- damaged banks, depressed home prices, debt-burdened consumers -- to achieve much liftoff.

Though some of the economy's weakness in the first half is temporary, "it is hard to see much on the horizon to cheer about," Swonk says.

AP Economics Writer Martin Crutsinger contributed to this report.